Product Strategy
Explore the process of untangling complexity, prioritizing impact, and building a roadmap to bring the business and users closer than ever.
OVERVIEW
Explore the process of untangling complexity, prioritizing impact, and building a roadmap to bring the business and users closer than ever.
Outcome
During this process my team and I helped untangling all the business complexity derived from Canon's operations.
This discovery process helped visualise and bring forward different business and development angles that would have been otherwise left unconsidered. But most importantly it brought the team together to focus and be part of a project that aimed for outcome, impact, measurability and delight.
Process
SDLC
The high level view of the process involved 3 different activities.
- DiDiscovery
- Design and Development
- Release

The goal of this case study is to document the work done in Canon to create a User Centred Roadmap that was going to deliver the most impact to the business. Product Design Sprints (Scrum) are in its own case study for readability purposes.
Discovery
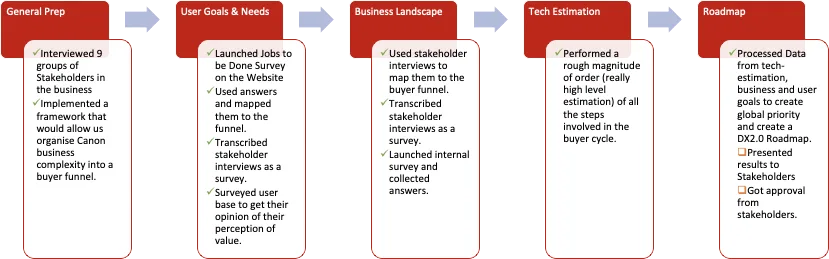
The first step to build the roadmap is to figure out what the plan could look like in order to get there. My boilerplate train of thought is the following:
- Identify stakeholders, constraints, general operating environment, etc.
- Understand business model, business strategy and map value generation.
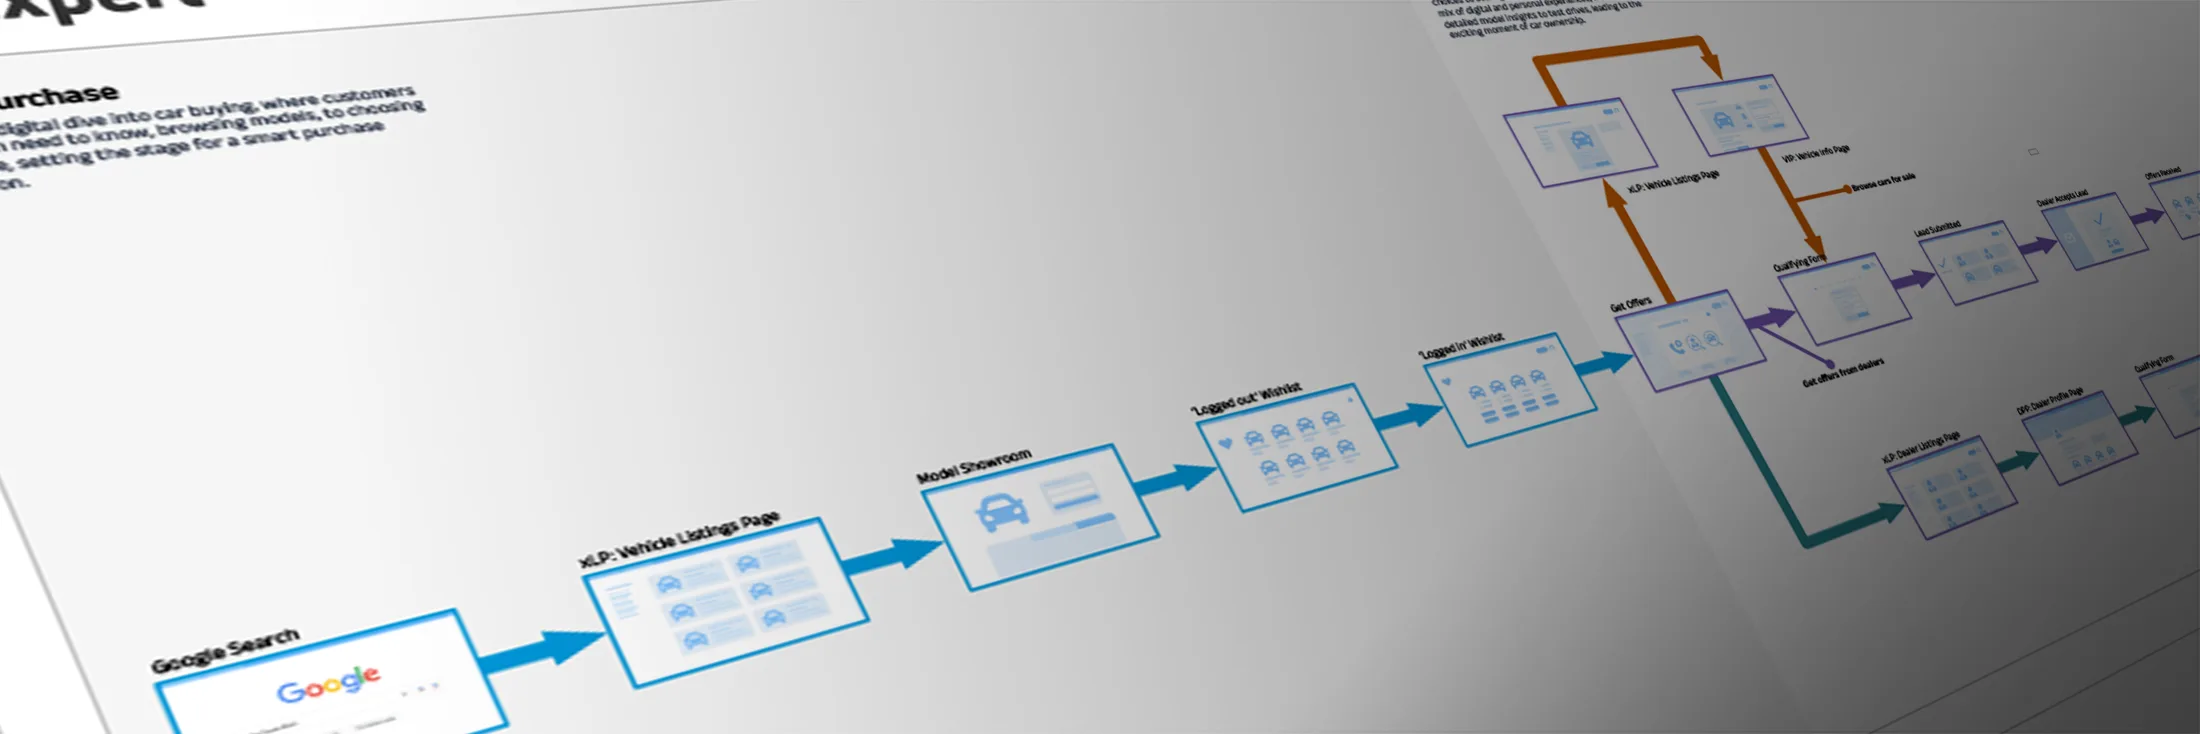
- Understand how users exchange value and map it against the buyer's journey.
- Really high level estimation of what could take to come up with a solution that enables the value exchange.
- Estimate bang for buck.
General Prep
"Complexity is often necessary. The design challenge is to manage complexity so that it isn’t complicated." – Don Norman
The operating environment in Canon was quite complex:
- Integrative. Complex back-end architecture; variety in legacy and underlying systems.
- Informational. Pricing, promotional and description presentation constraints to adhere to ACCC.
- Intent. Competing goals between stakeholders (i.e. Support and Sales).
- Environmental. Difficulty to coordinate meetings with a large number of relevant people.
- Institutional. Hierarchical vetoing of the work produced.
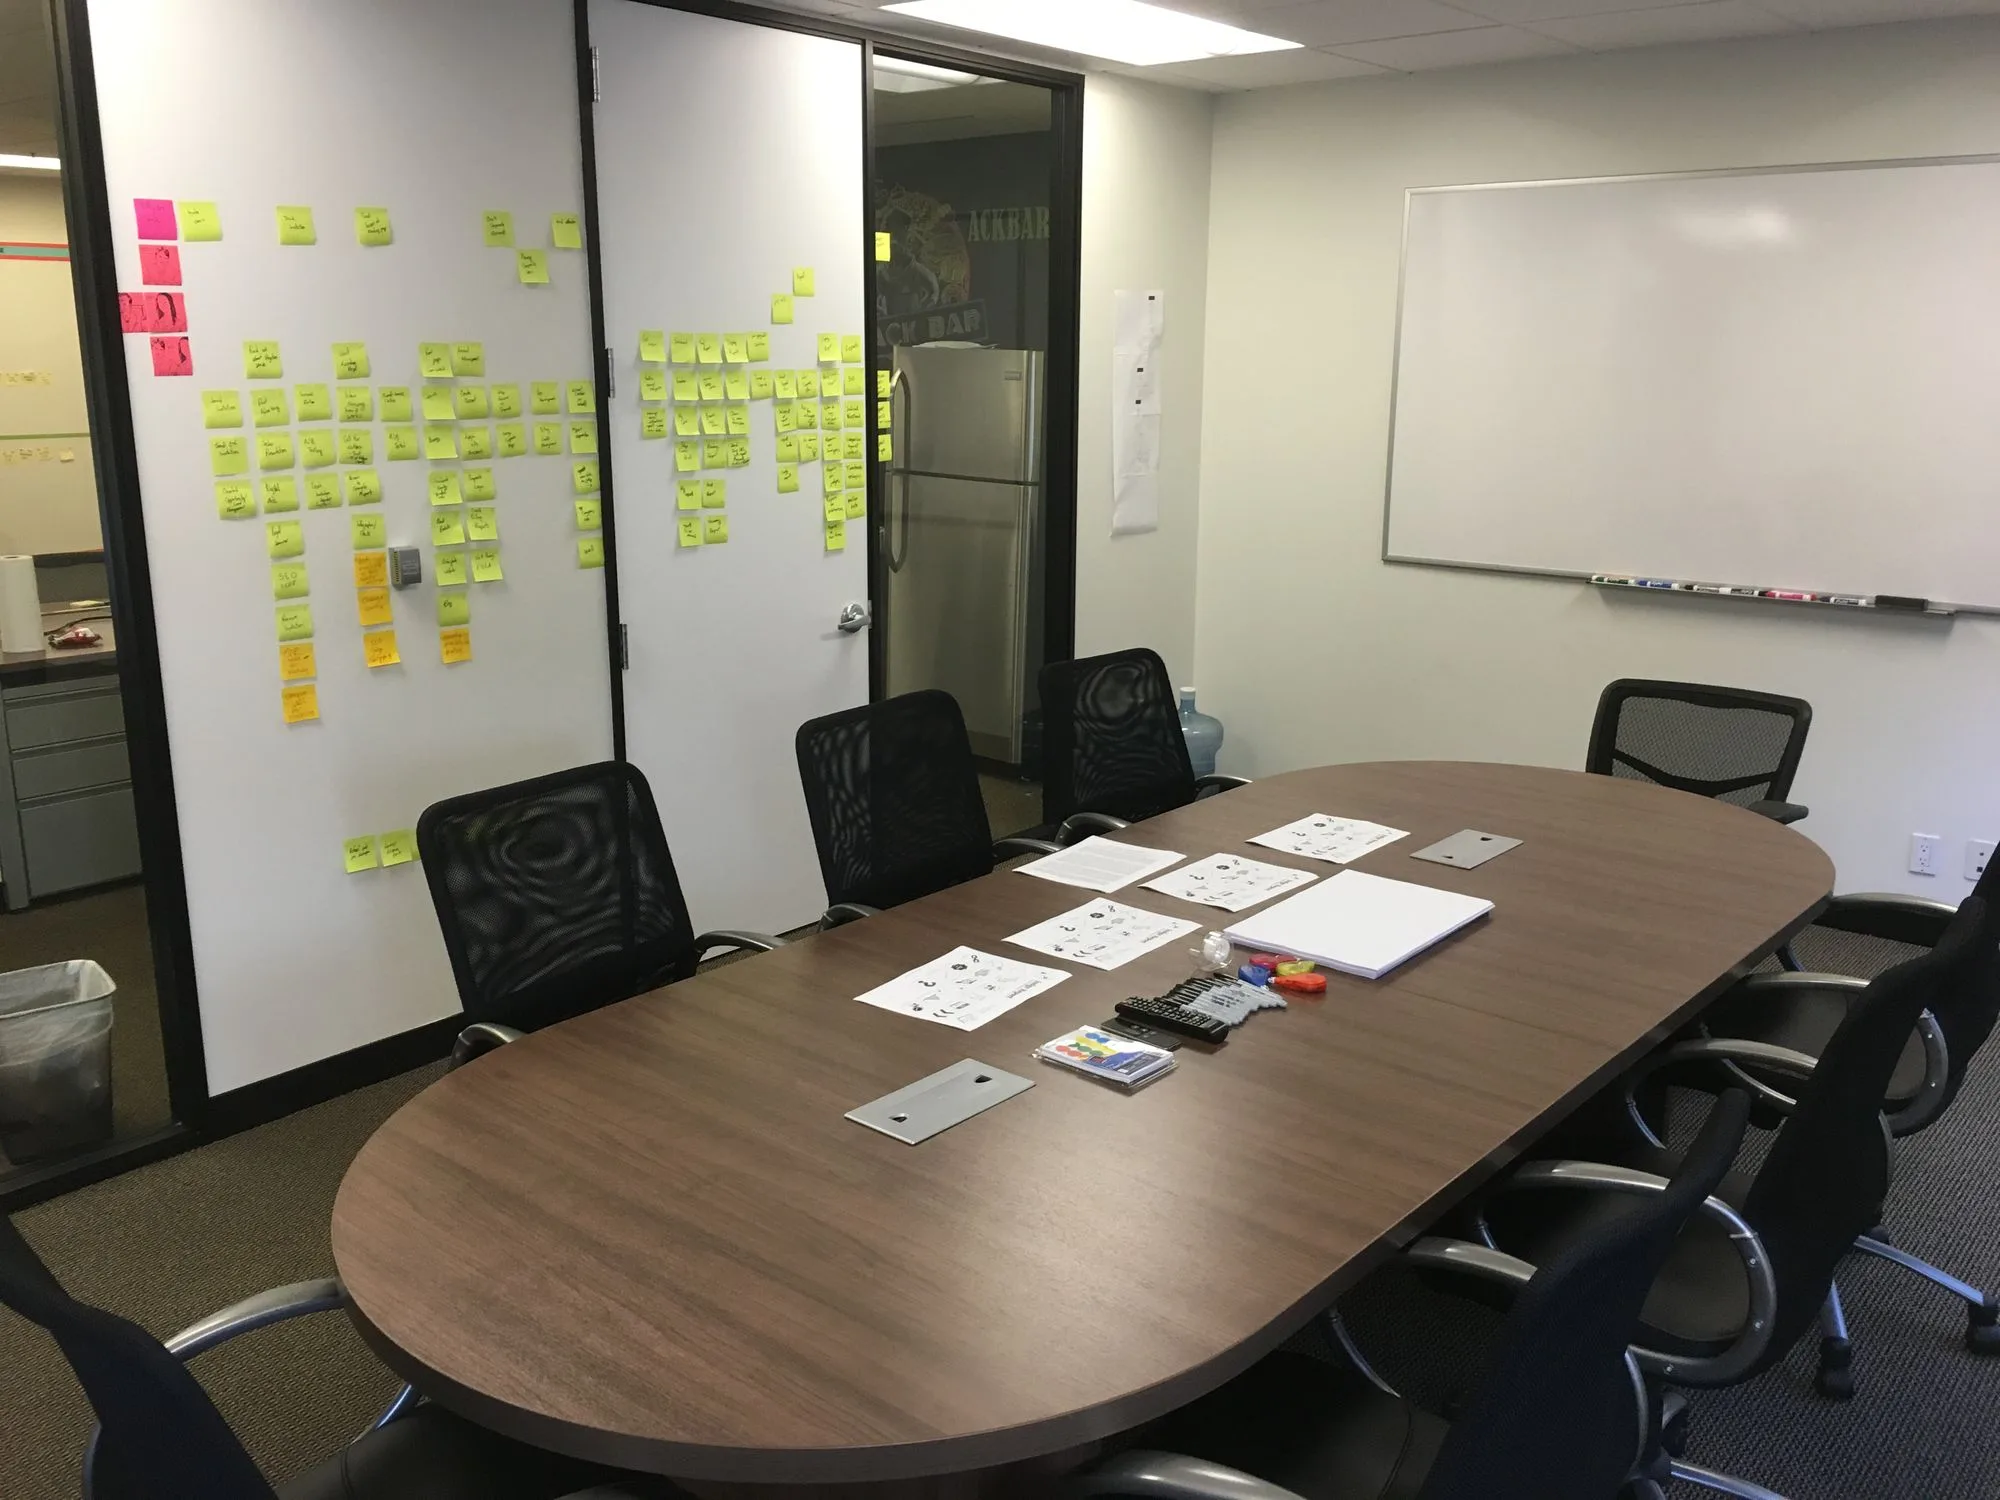
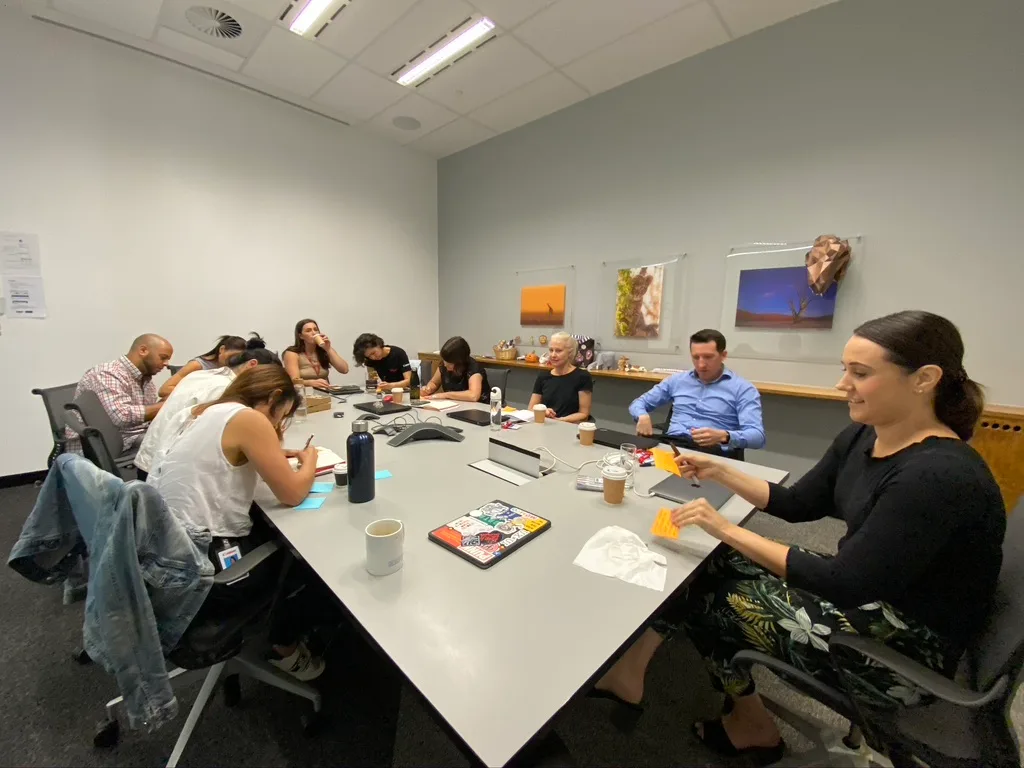
In order to get familiar with the complexity and factor it in the design in the most elegant form, I led a series of workshops with different stakeholder groups where they had the opportunity to talk about their team's specific drivers.
Work-domain analysis (Sequencing of User and Business Needs)
The result of having multiple stakeholder workshops produced a wealth of unstructured knowledge. During these workshops we tried to affinity map as many concepts as it was possible. The structure of these workshops was roughly the following:
- Agenda and Goal Setting
- Individual Generation
- Pitch and Present
- Affinity Mapping as we go
- Summary
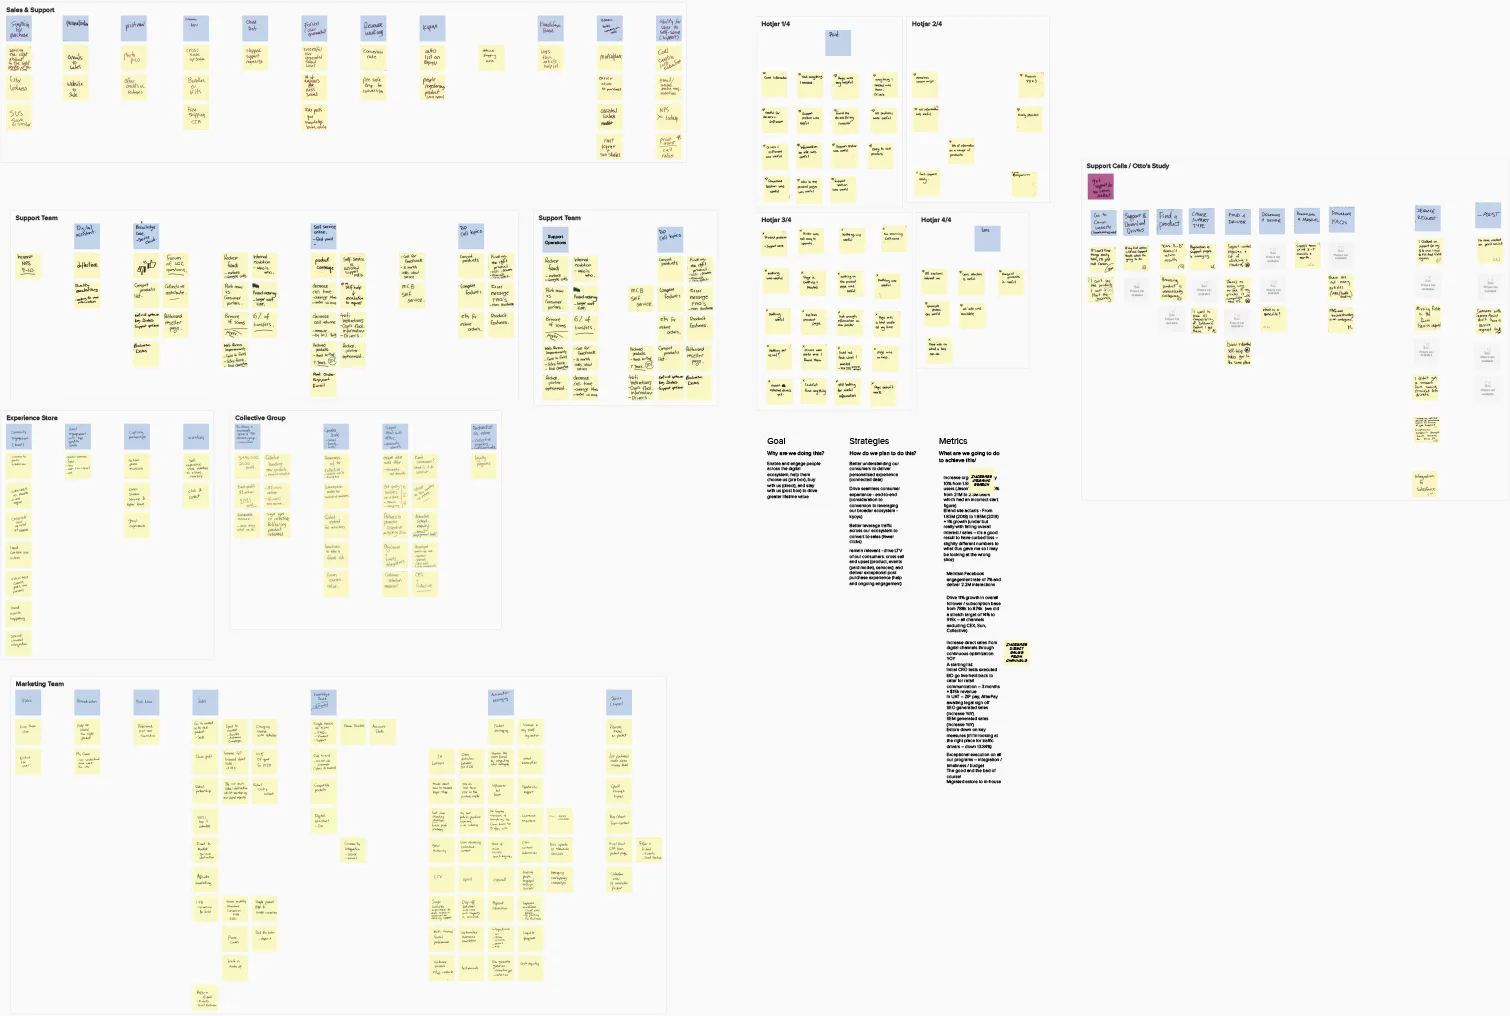
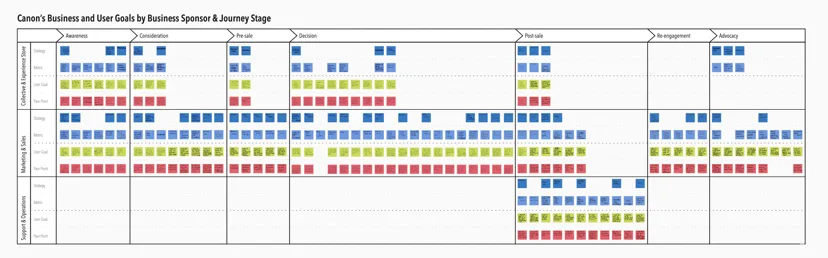
After all these workshops, my team and I cleaned up he journey by (1) removing duplicate sticky notes and those with style differences but with the same meaning and then (2) segmenting the journey in 7 different stages and three swim-lanes.
Stages
- Awareness
- Considerenation
- Pre-Sale
- Decision
- Post-Sale
- Re-engagement
- Advocacy
Swim-lanes
- Support & Operations
- Marketing and Sales
- Collective & Experience Store
We also rewrote each of the sticky notes trying to ask ourselves what would that do for the business and what would that do for the user. Similar to what I've done in Discovery in Musica Viva or Discovery in Gavelytics, but in a more sophisticated way that allowed the team to visualise and work with the strategies and metrics for the complex business landscape in which Canon operates.
Validation and Prioritisation
Up until this point we have collected a bunch of top-down information from the business regarding how they see the company generating value and the users of the website tapping into that value. However the top-down, stakeholder-driven nature of the 90+ points in the map was only an assumption, so we had to validate, and prioritise them.
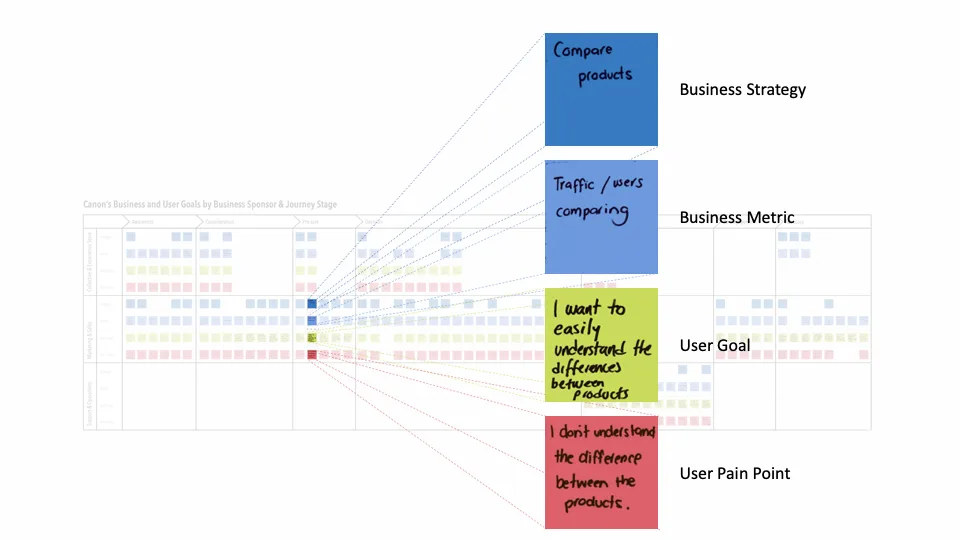
Each of the sets of 4 sticky notes was then re-written as a statement, which was to be prioritised individually by users and stakeholders alike.
We sent a survey to opted-in subscribers in exchange for a discount on a Canon product, and collected around 70 answers that assigned a User Value to the whole list.
Then we did a similar exercise with 30+ key Canon employees to assess the Business Value.
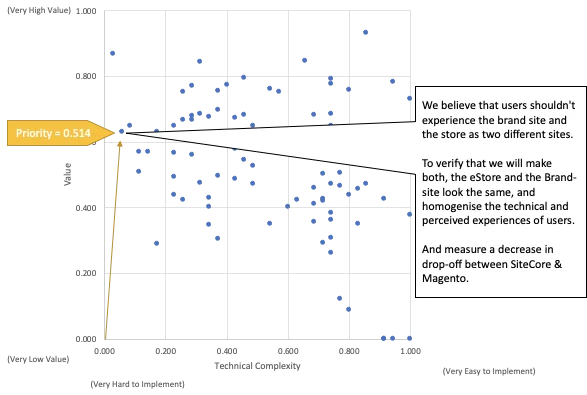
Value
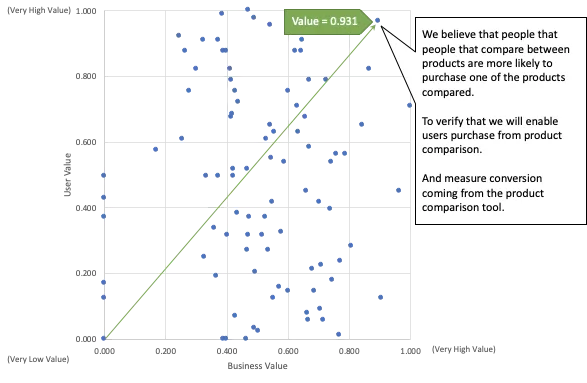
The result of the exercise above was a scatterplot that allowed us to see all the sets of sticky notes with a value ranging from 0 to 1.
We then deemed valuable anything that carried both high Business and high User Value.
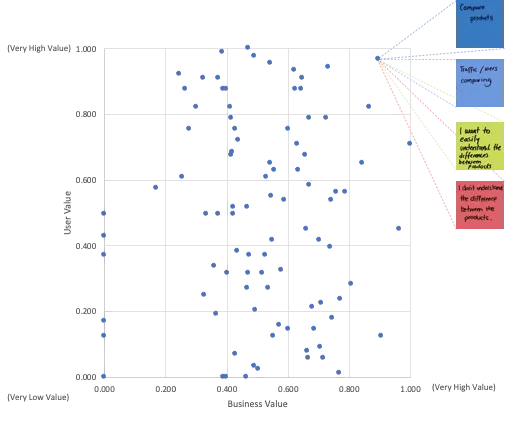
As a matter of fact anything in the top right of the chart was something worth looking at developing first.
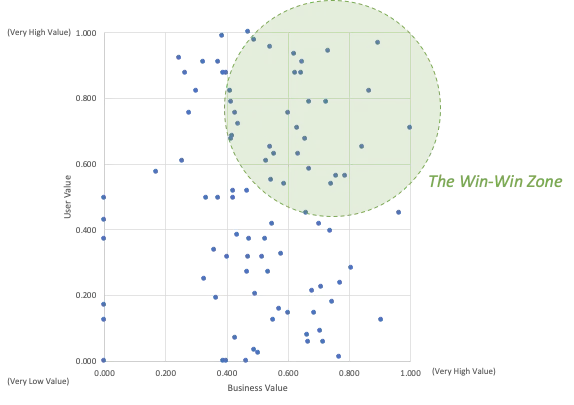
The degree of something being meaningfully useful to both users and business alike is great. However we had to know how difficult was going to be building it.
Nominal Priority
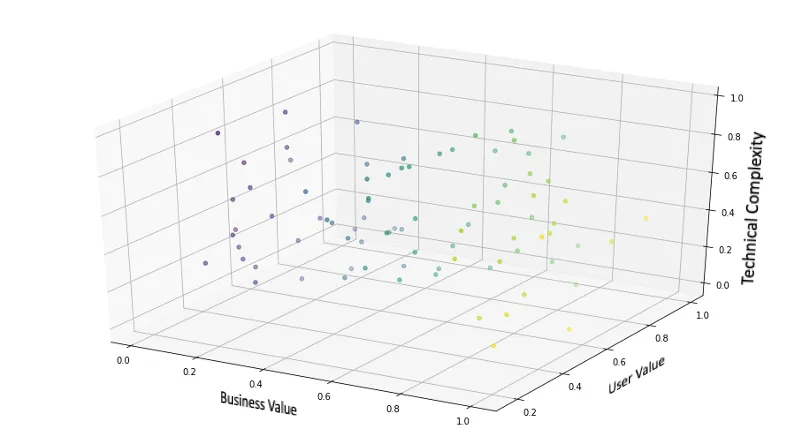
I led a number of sessions with representatives of the technical team, where we discussed the difficulty of each of the dots as compared to all other dots. Although relative complexity is not a perfect science, it allows for rough estimation.
The outcome of the tech session allowed us to add Technical Complexity to the mix, which makes a 3D scatterplot that behaves in the same way than the 2D version of Value. And it looked like this.
In order to make it more human-readable, the following two charts compound User and Business Value into one axis: Value. Then Value is mapped against Ease of Implementation.
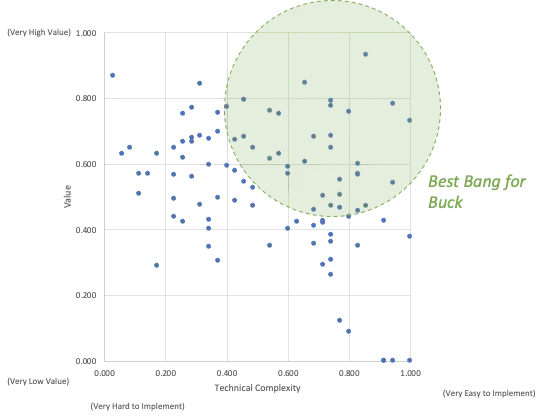
And in a similar way, that top-right quadrant, gave us a good indication of focus for the project. All of those top-right things are Business Strategies or Metric enabling features that are worth building as soon as possible. However, there's something else to be considered.
Strategic Priority
Strategic Priority is not only cool sounding, but the ultimate kind of strategy that you can have in product development (especially when you compare it against Whimsical Priority).
To get Strategic Priority we need to take into consideration the following:
Constraints, such as:
- Seasonality
- Investment
- Product Releases
Technical Dependencies, such as:
- Back End Integrations
- Migrations
- Platform Updates, Bugs, etc.
The number gives you a degree of importance, but ultimately it is the goal of the designer to facilitate which building blocks are going to be foundational and therefore prioritsed for the success of the business.
Impact Adjusted Roadmap
Story-mapping
Based on all the information gathered so far. The next step was to unpack the work domain analysis into a Story Map that was broken down into the following levels:
- High Level Actors (Purple)
- Task (Pink)
- Step (Blue)
- Details (Yellow)
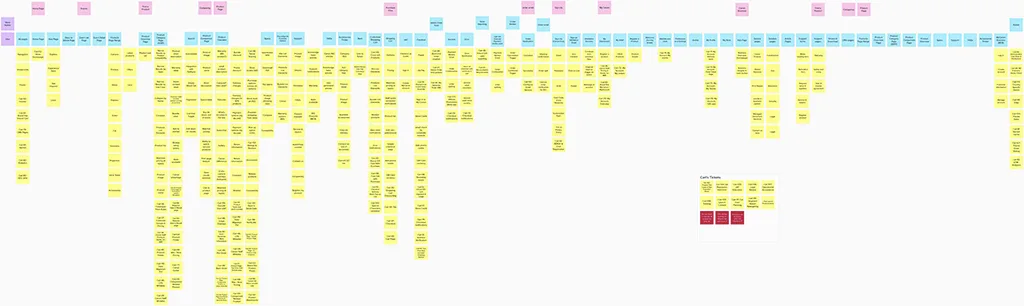
Story-mapping Break down
The next step was to identify how the team was going to be work during the length of the project and break down the map accordingly. So we agreed to break the map as follows.
In essence everything contained between a pair of black lines is something that conceptually we can talk about as a body of work.
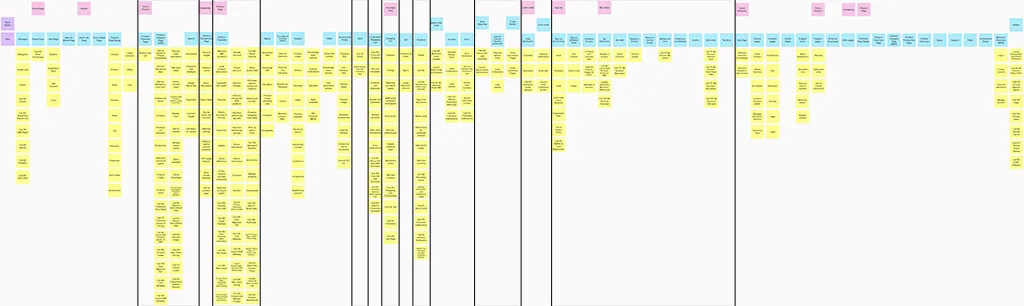
High Level Roadmap
I led the team to align the size of a module from the Story Map to something that was realistically to be completed within the time-frame of a development sprint adjusted for the resources we had available.
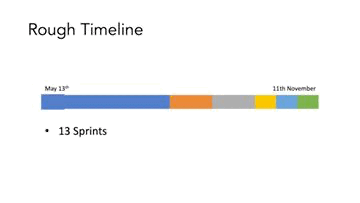
The project allowed for 13 Sprints
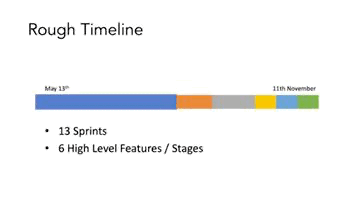
Low Level Roadmap
With each of the modules of the Story Map helping as sprint scope, we decided to daisy chain the design and development sprints as follows.
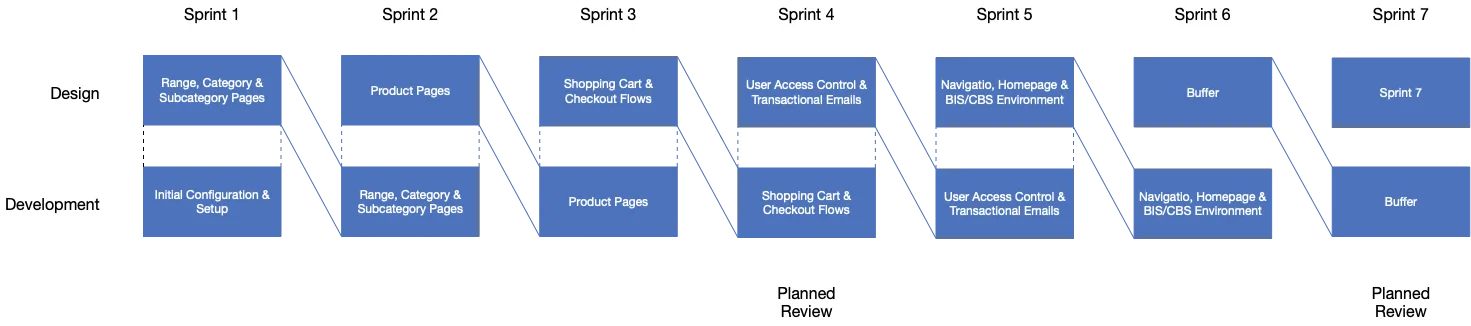
We kept the conversation open and adjusted direction as we saw fit, keeping the end goal in mind.
Design Sprints
The next step in this process was the Product Design Sprints (Scrum), which are documented in their own section.
Observed Problems and Potential Solutions
Learning opportunities highlighted in the table below.
| Problem | Solution |
|---|---|
| The first one was that some of the Stakeholders were not really tech driven and got disengaged during he process of facilitating touch-points for the Work-domain analysis, which made us overlook some of the things that needed to be considered for the project. | Having a playbook that explains the process from beginning to end in plain english is a must. This playbook could potentially be referenced every single time we meet with stakeholders, to help them understand why they are there, what the goal is, and what happens if they are just cruising the sessions. |
| The tech team, was initially skeptical about the process, which made them disengaged at the beginning and tried their own thing to get technical requirements as they were not "UX". | Next time around I would double down on how important is to move together is essential to fix this. To do this I will address stakeholder concerns by listening and facilitating a solution that considers their point of view. |
| We initially ran an intercept survey on the website in order to get a glimpse into the motivation of our user base, which yield no results, and made the process slower. | I would attempt two simultaneous research methods to avoid stalling for too long. It is important to keep in mind to remain flexible, and avoid as much as possible to interrupt the users' flow when they are trying to accomplish something (as it was an intercept survey). |
Edgar held the role of Head of Product and Design at Canon between 2019 – 2021 in Sydney, NSW.
RELATED CASE STUDIES