Strategic Research
Transforming market approach through user research and design thinking, how I created distinct buyer and seller personas, to enable the identification of unique business opportunities in a saturated marketplace.
OVERVIEW
Transforming market approach through user research and design thinking, how I created distinct buyer and seller personas, to enable the identification of unique business opportunities in a saturated marketplace.
Outcome
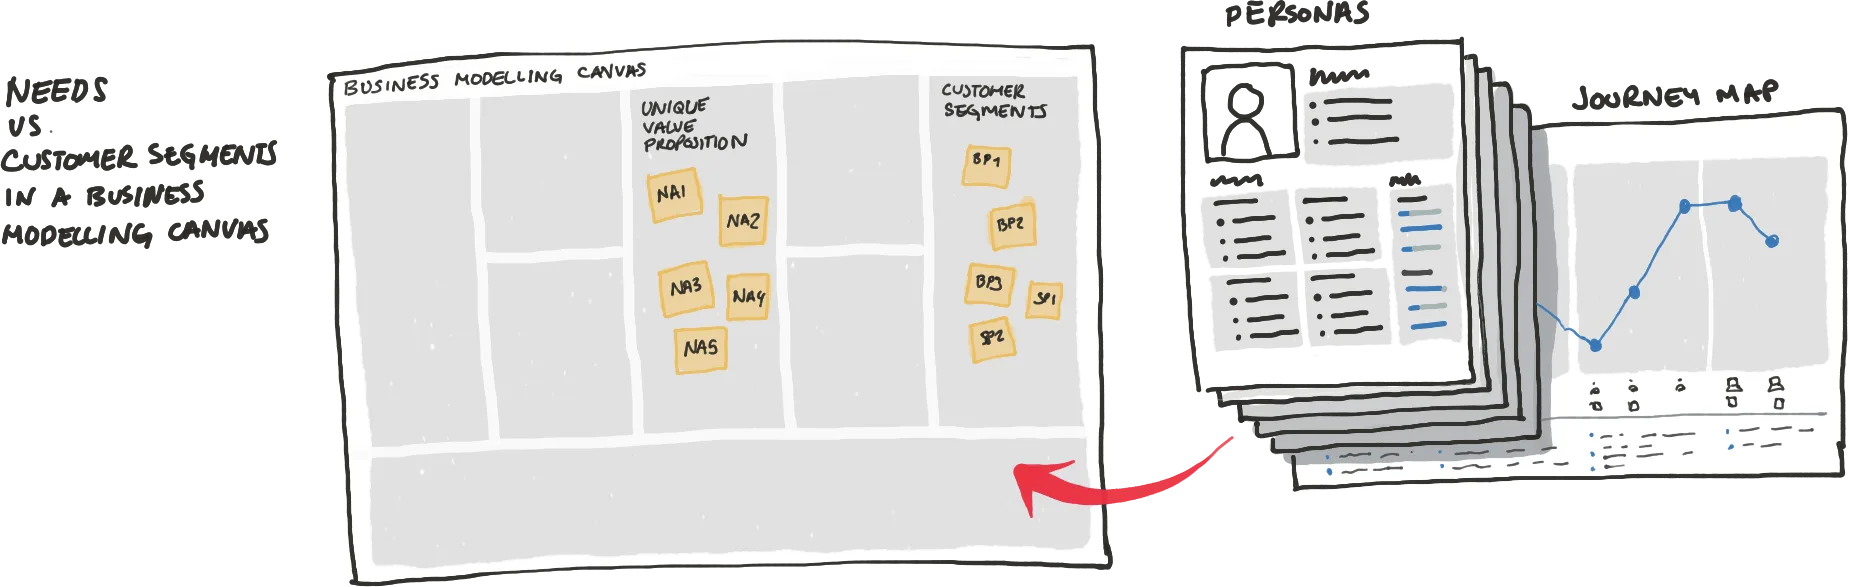
As a result of this 2-month-long research piece Autotrader was able to find the next big focus in a new range of innovative value propositions to take on in order to help the company capture more organic leads and differentiate itself in a really saturated market.
This process identified 20+ Business Opportunities through Research + Design Thinking, where the business could easily innovate.
Overview
The process below shows how by doing user research and having an end game to it, can help organisations become more user centred and gain market capitalisation as a result of it.
Through this process I was able perform and lead my team to exert the following skillsets
- Design Thinking
- Assumption and Research Based Personas
- Qualitative and Quantitative Research
- Data Visualisation
- Affinity Diagraming
- Journey Mapping
- Business Modelling
Process
Carsguide has undergone the process of doing personas at least three times. Each time they got Driver personas, like the "Jane - The Sports Mum" that drives an SUV to take her kids with dirty clothes with their gear to the game and back. Or "Joe – The Mid-life Crisis Executive" that likes to drive expensive cars. And while looking at their pain-points and goals, I devised something fundamentally wrong with these personas: They didn't focus on the activity at hand: The transaction. While Jane and Joe might have been well crafted personas, they were driver personas, and not quite "I'm in the market to buy a car" personas.
So I embarked in the process of creating the right kind of personas for Carsguide / Autotrader.
1. Proto-Personas
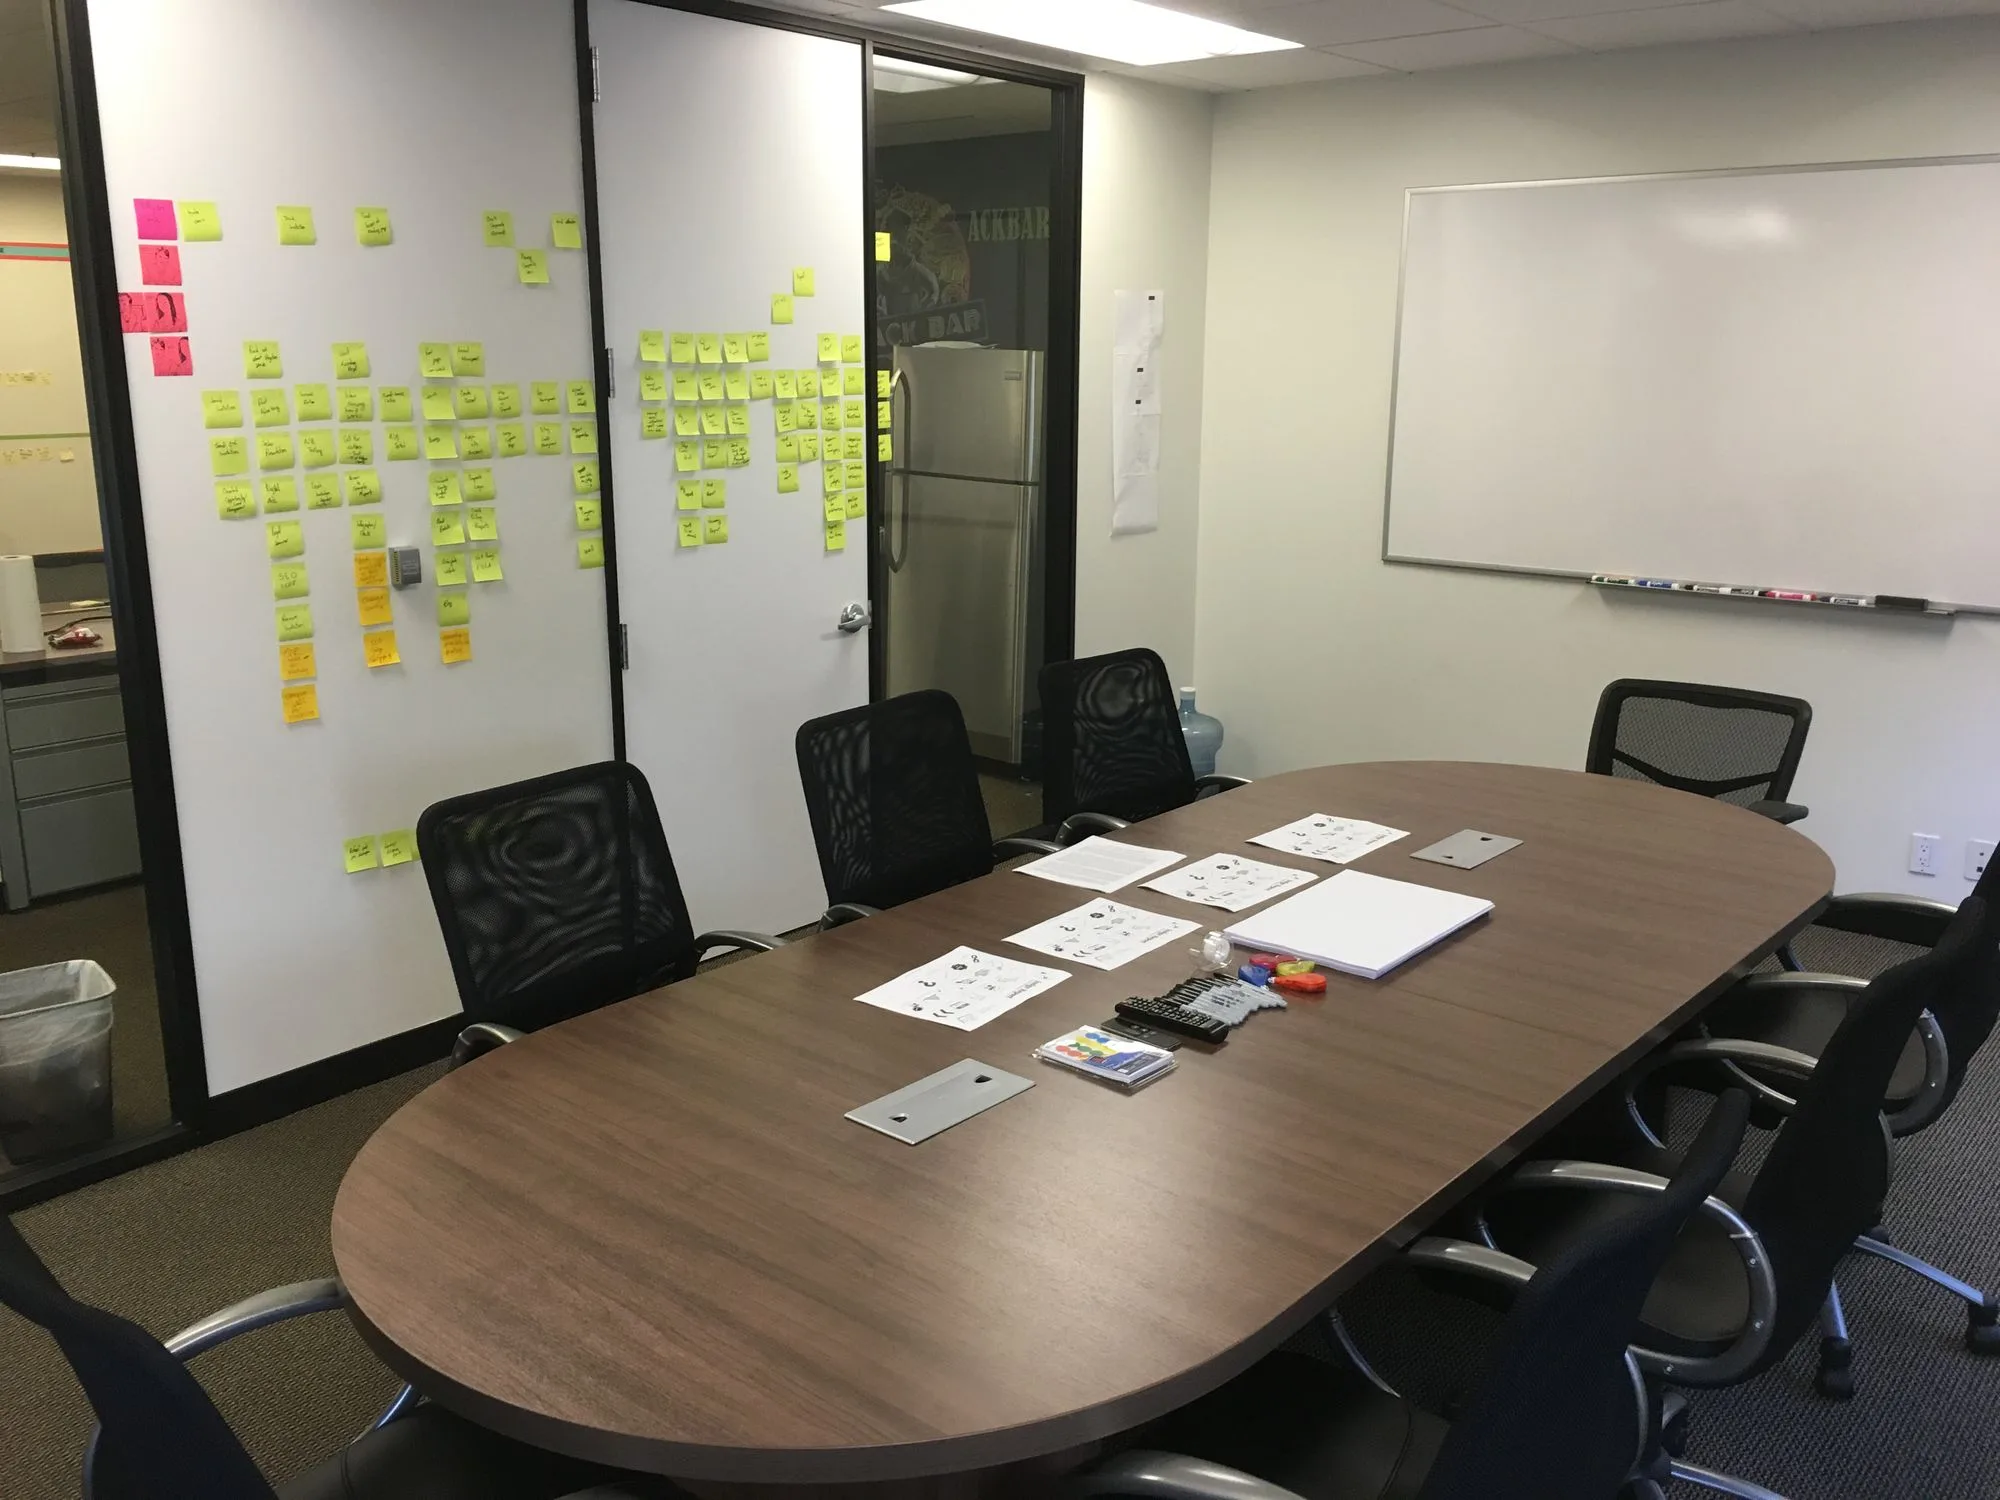
I kicked of the process by asking representatives of different stakeholder groups to sketch out and define who they thought were the users of our website. This was done through a workshop that had the following structure:
- Agenda
- Instructions
- Individual Generation (point 1.1 below)
- Presentation
- Affinity Diagraming of Pain Points and Goals (point 1.2 below)
1.1 Individual idea Generation
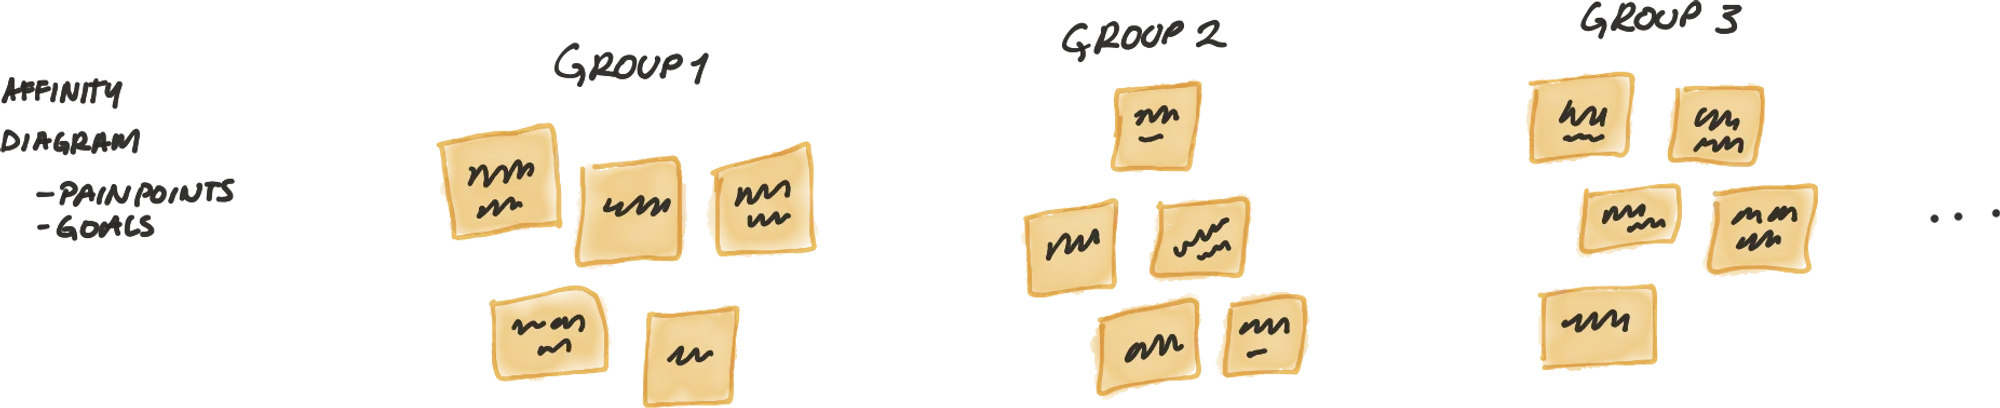
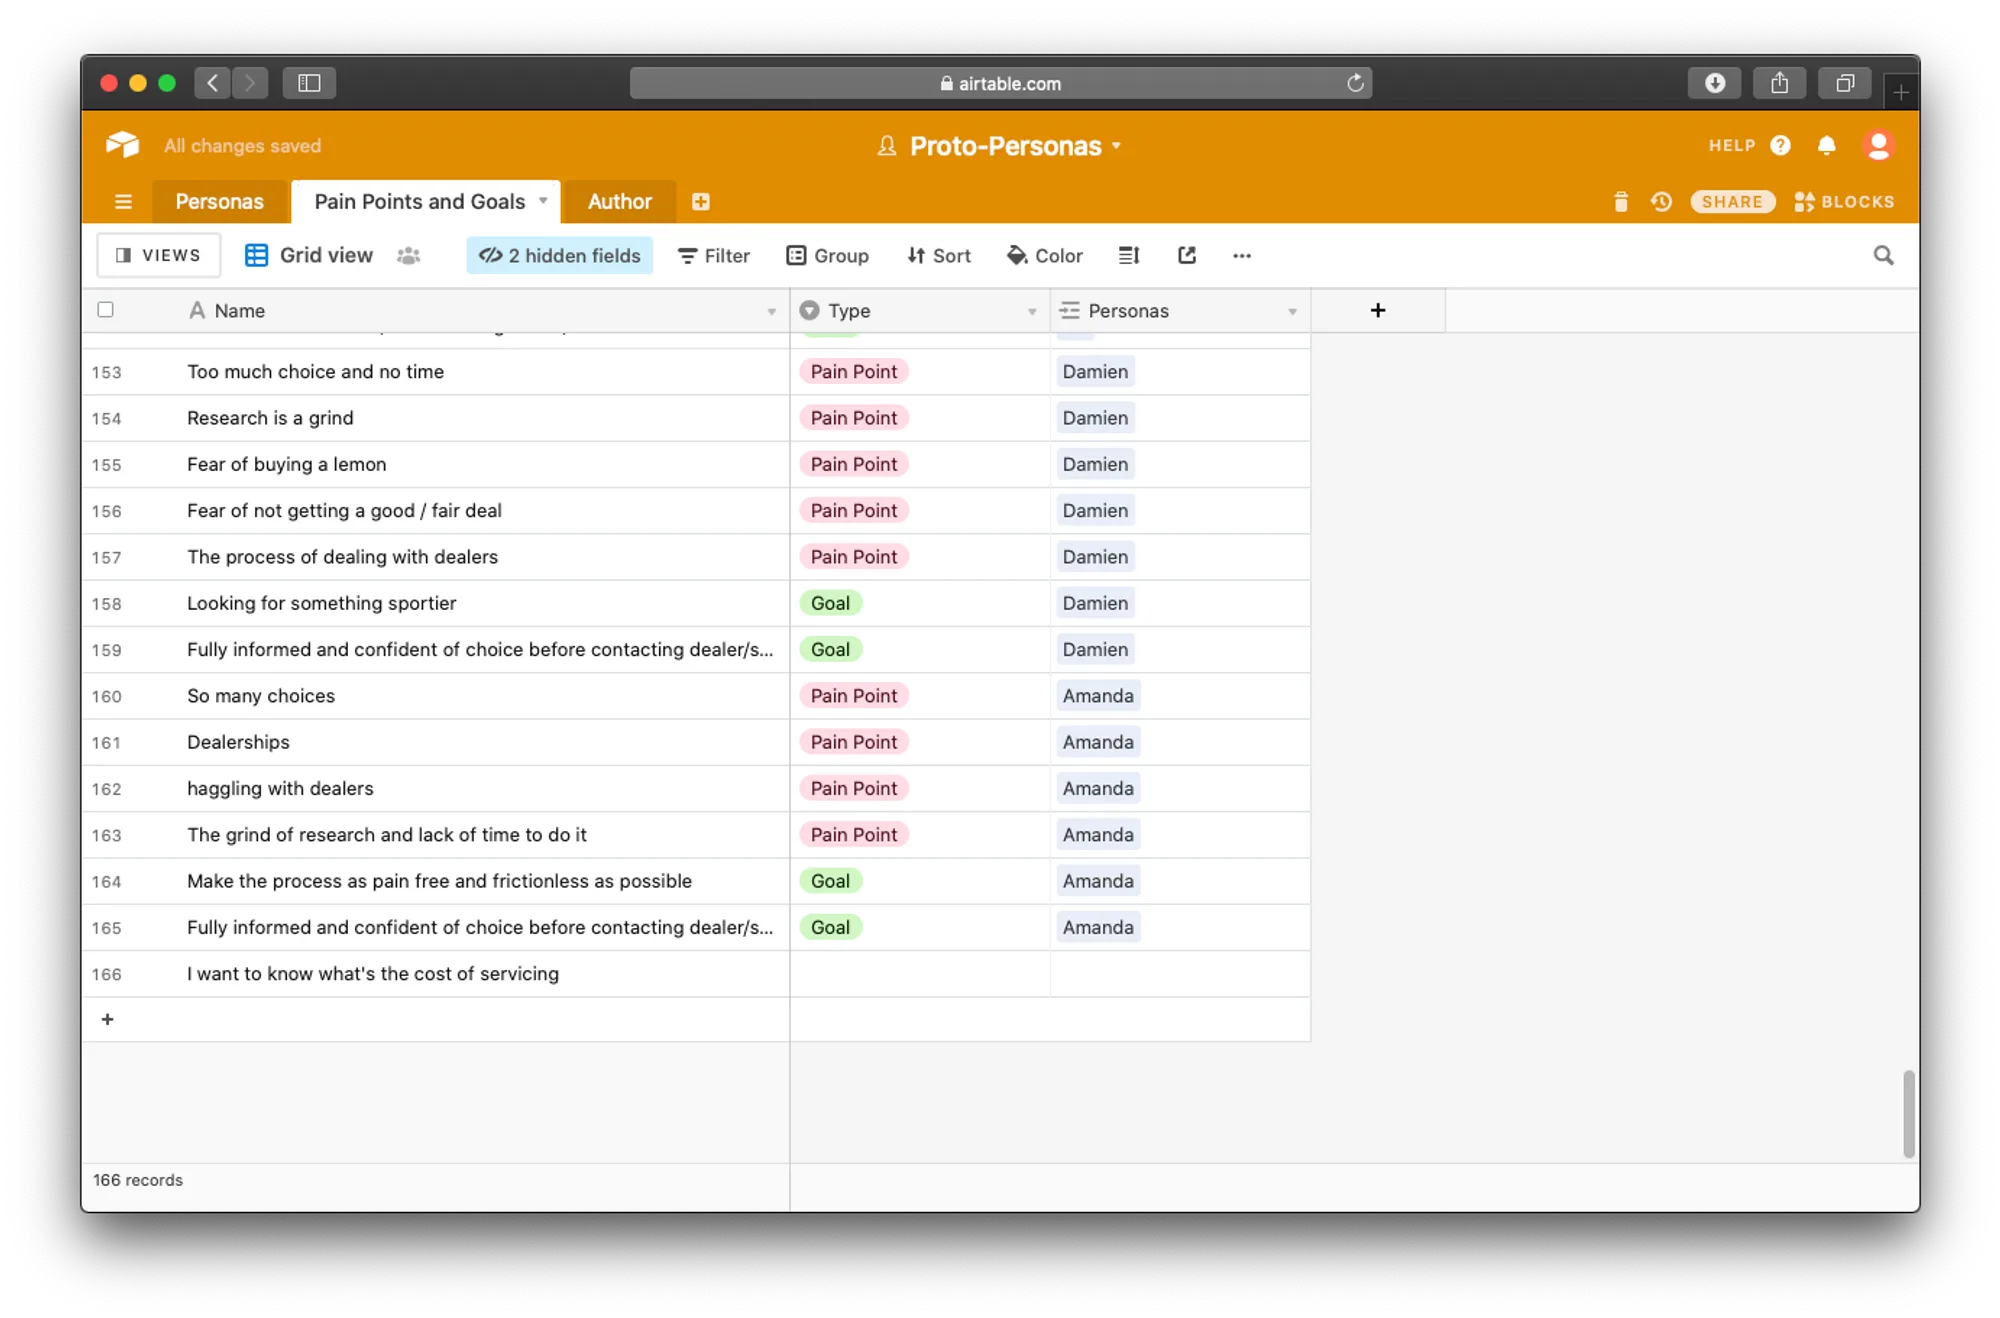
1.2 Identifying Behavioural and Demographic Traits
Once all the useful information from our proto-personas was captured, we had to remove the noise that came from semantics, writing style and repetition, and started identifying themes.
Then we gave those clusters a name, which became an attribute or trait type, and the range of values that that attribute or trait type could take was described by the different sticky notes inside the cluster.
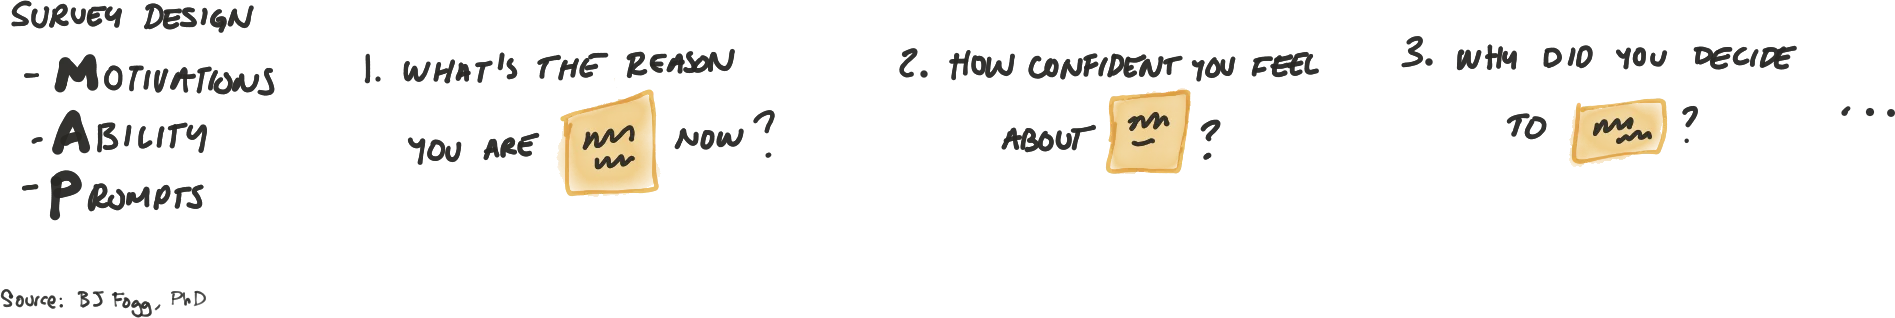
2. Surveying User-base
Then in order to move away from our assumption based personas, I rewrote all the different groups into questions of a survey, making sure that traits that we were enquiring about were something that was likely to affect behaviour on the website.
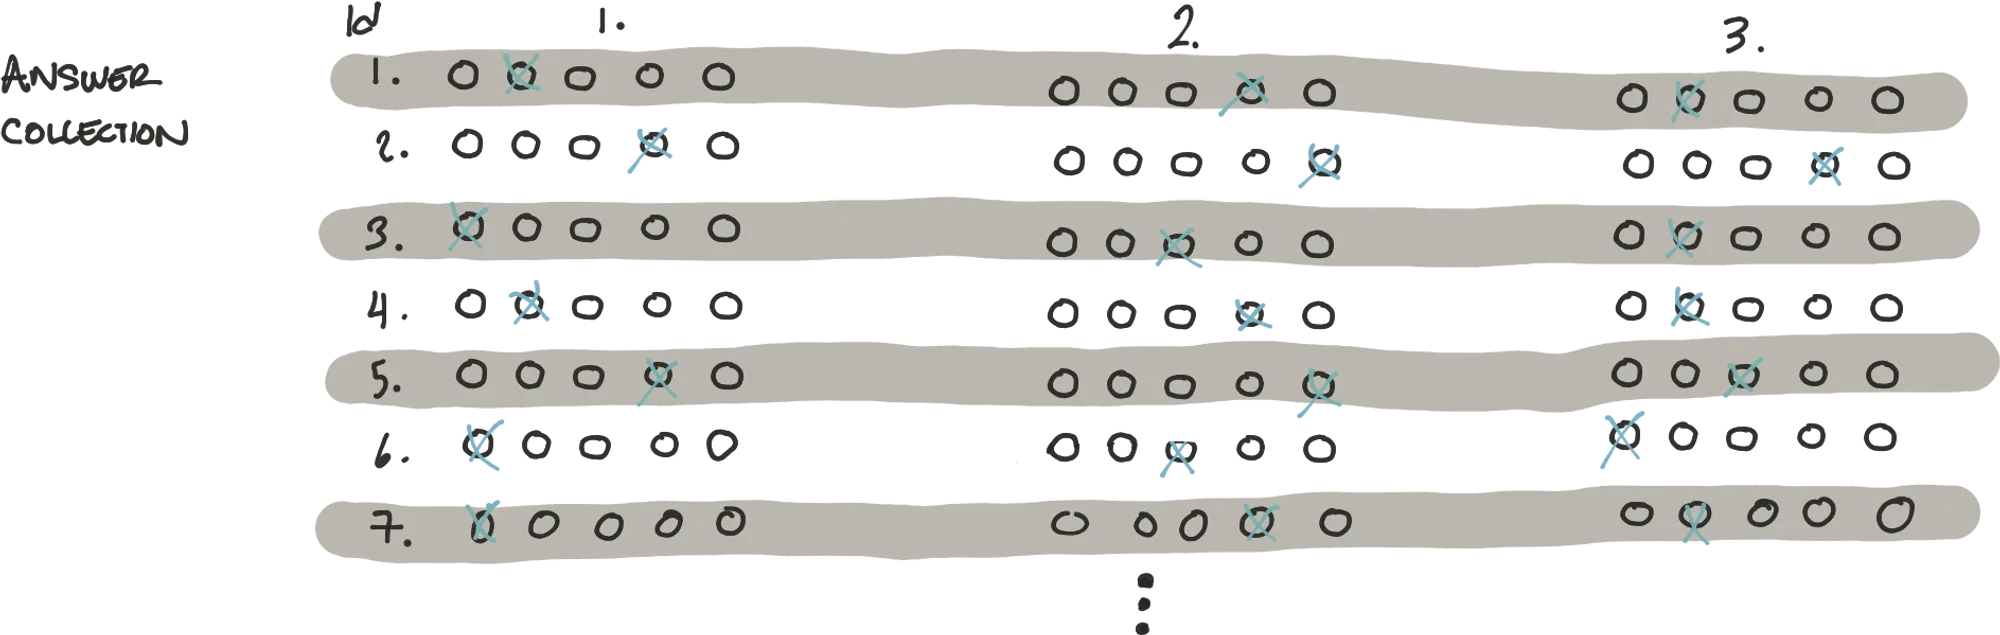
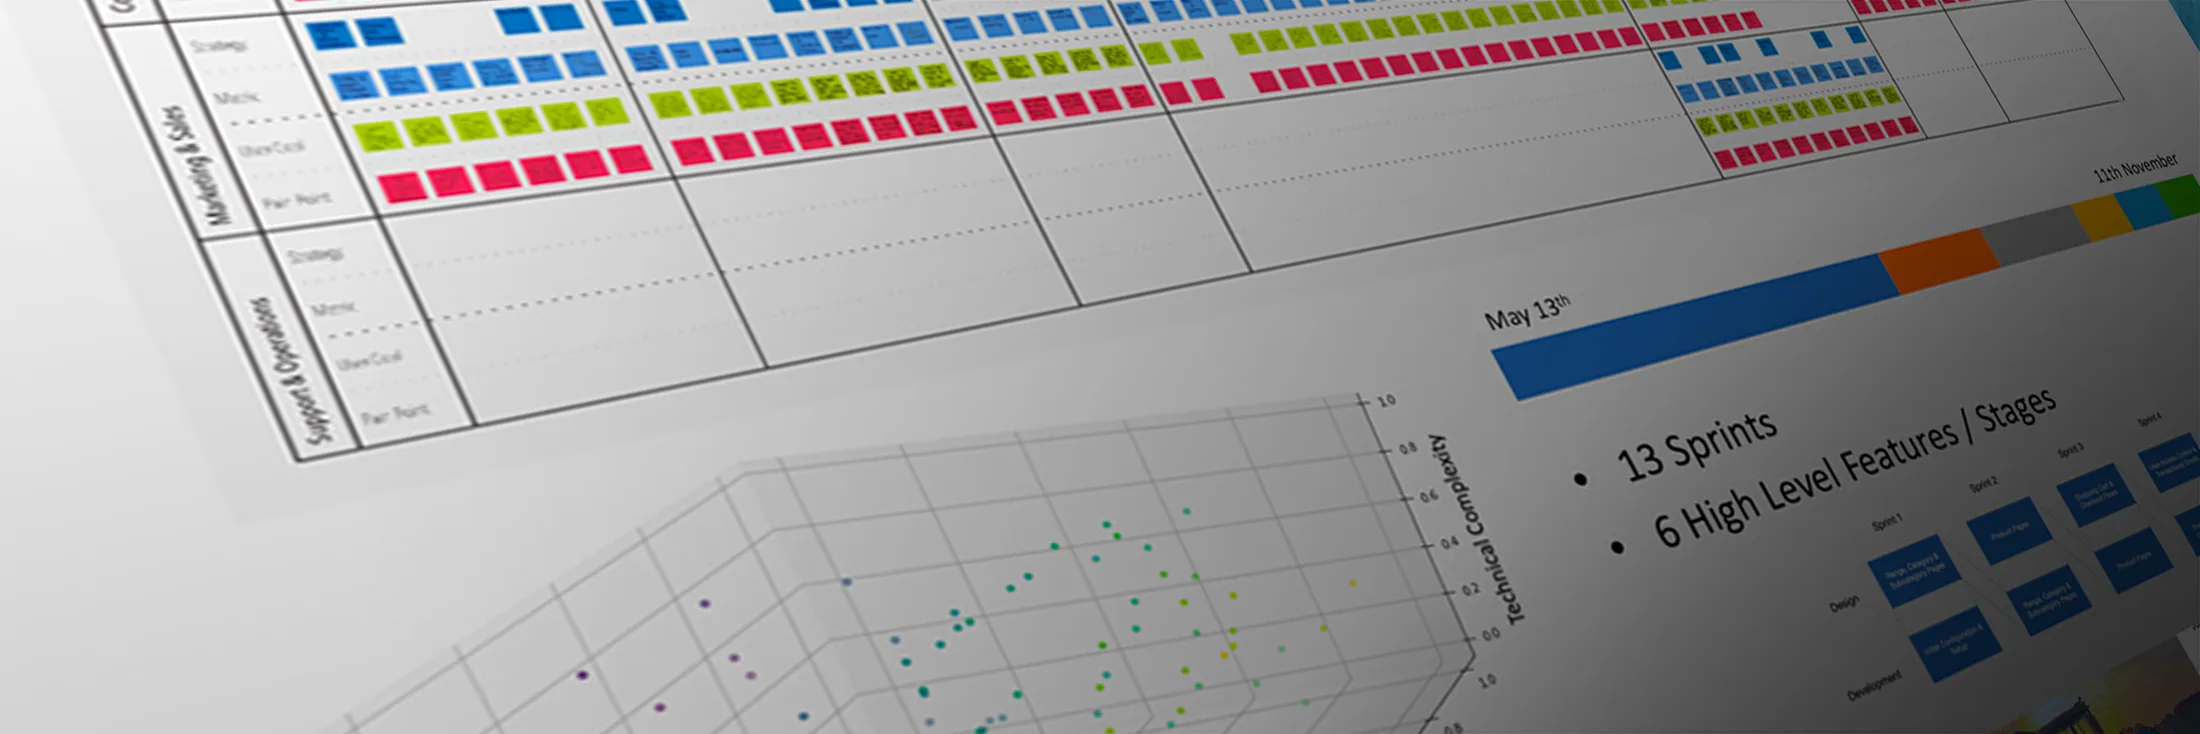
3. Programmatically Identifying User-base Clusters
After getting around 2000 answers, I coded in python a script that would allow me to check the similarity between one survey answer (node) against each all others. And I did this for each survey answers (yes, that's 4 million comparisons).
Each comparison carried a similarity score based on Pearson's correlation, which is easy to do using Pandas library in Python.
Naturally in the network, each node has a correlation value against all other nodes. But we were only interested in the nodes that were strongly correlated.
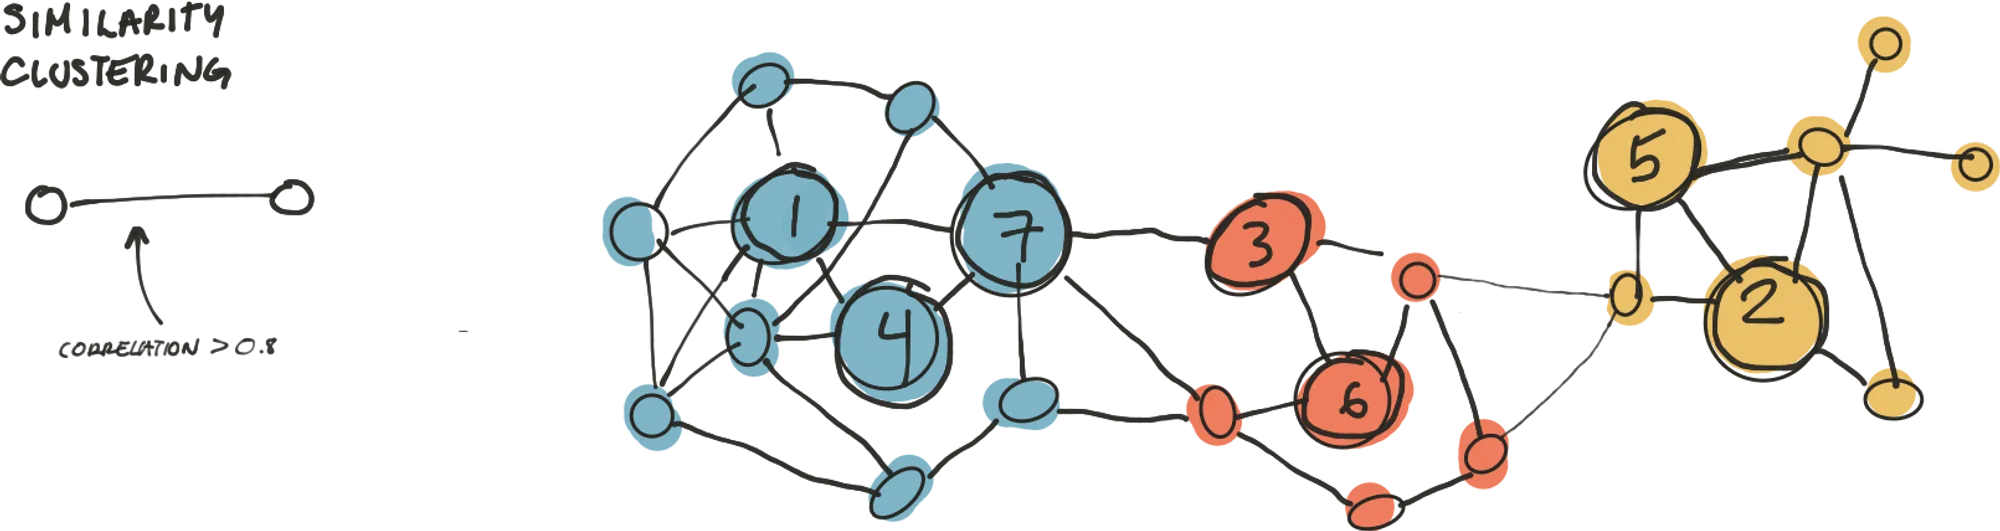
The outcome of the script looks something like this:
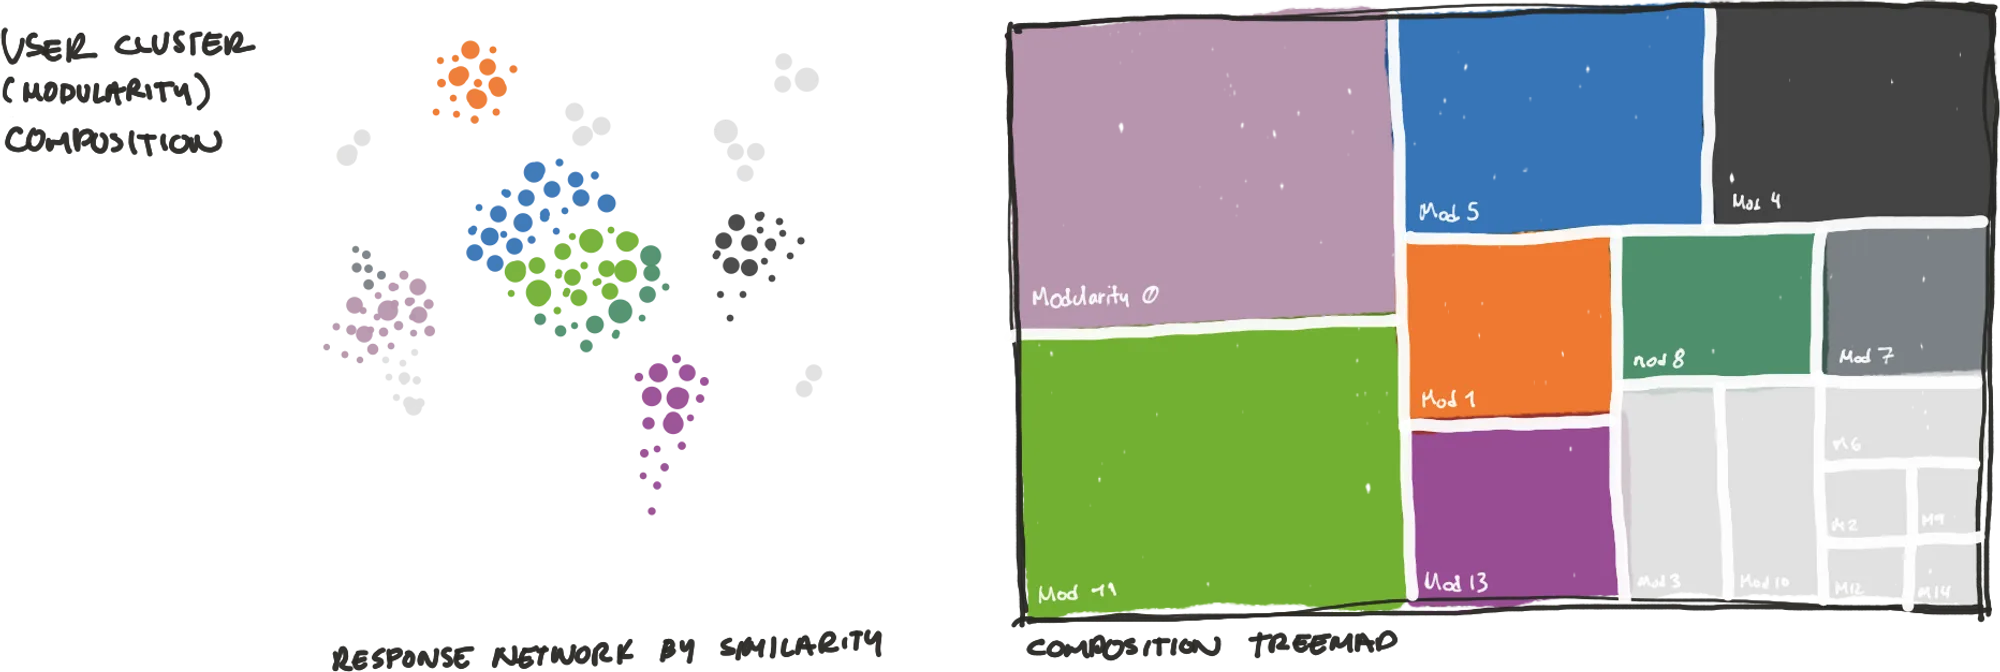
For simplicity, in the explanation I used 0.8 correlation; however, I used a more sophisticated approach to determine what was the best correlation value based on on the number of communities produced by the algorithm, that included 80% of the nodes. The real value was 0.775.
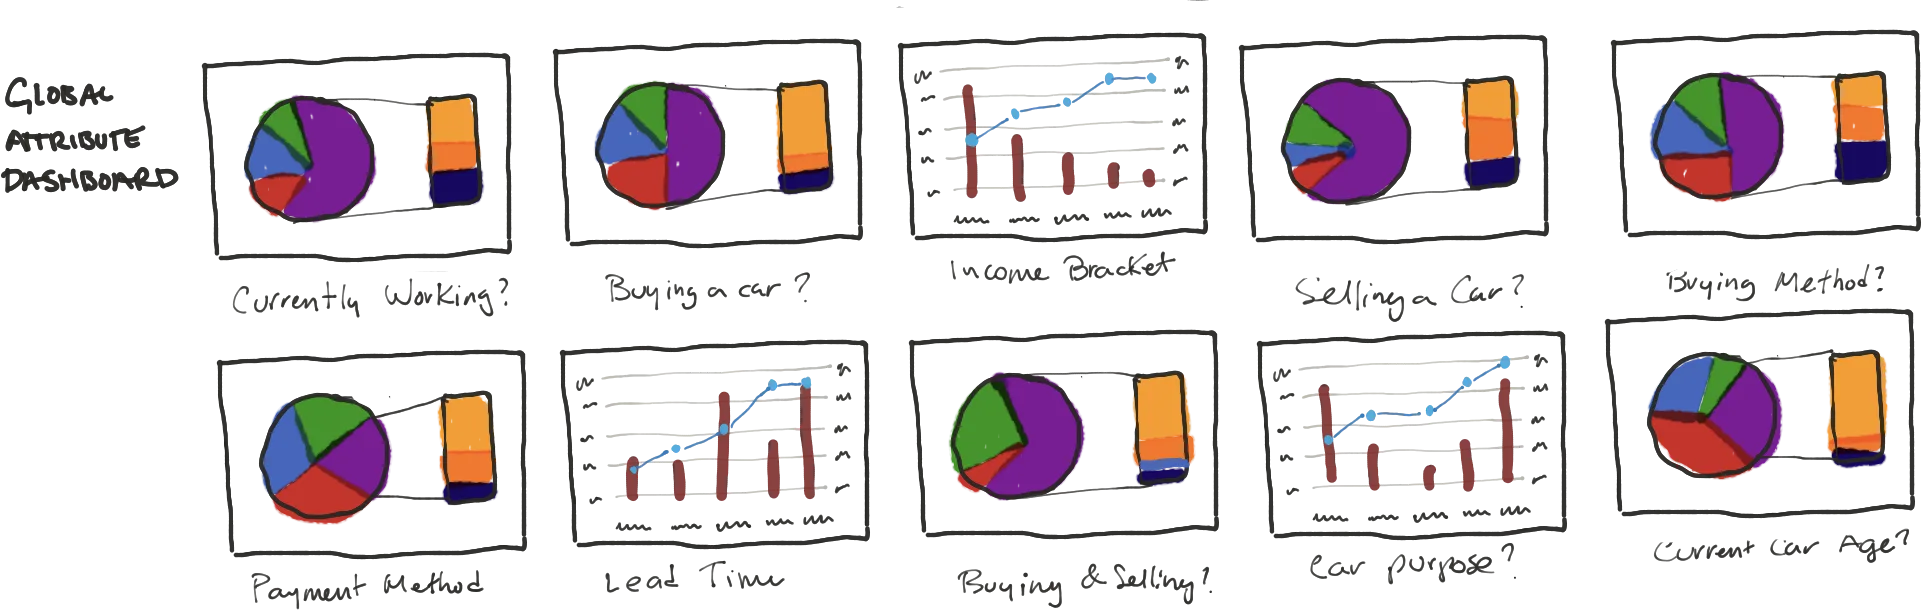
3.1 By-product: General Demographic Information
A nice byproduct of doing the survey, is that you can look really close at the demographic and attitudinal make up of your whole lot of users in a statistically valid way.
4. Cluster Definition and Screeners
By aggregating the data per modularity, we were able to write 15 different screeners. One per modularity.
The questions in the screener remained the same across all different screeners. But the "pass" answers changed from screener to screener.
With the screeners done, now the next step would be to interview people and identify what is their buying / selling process.
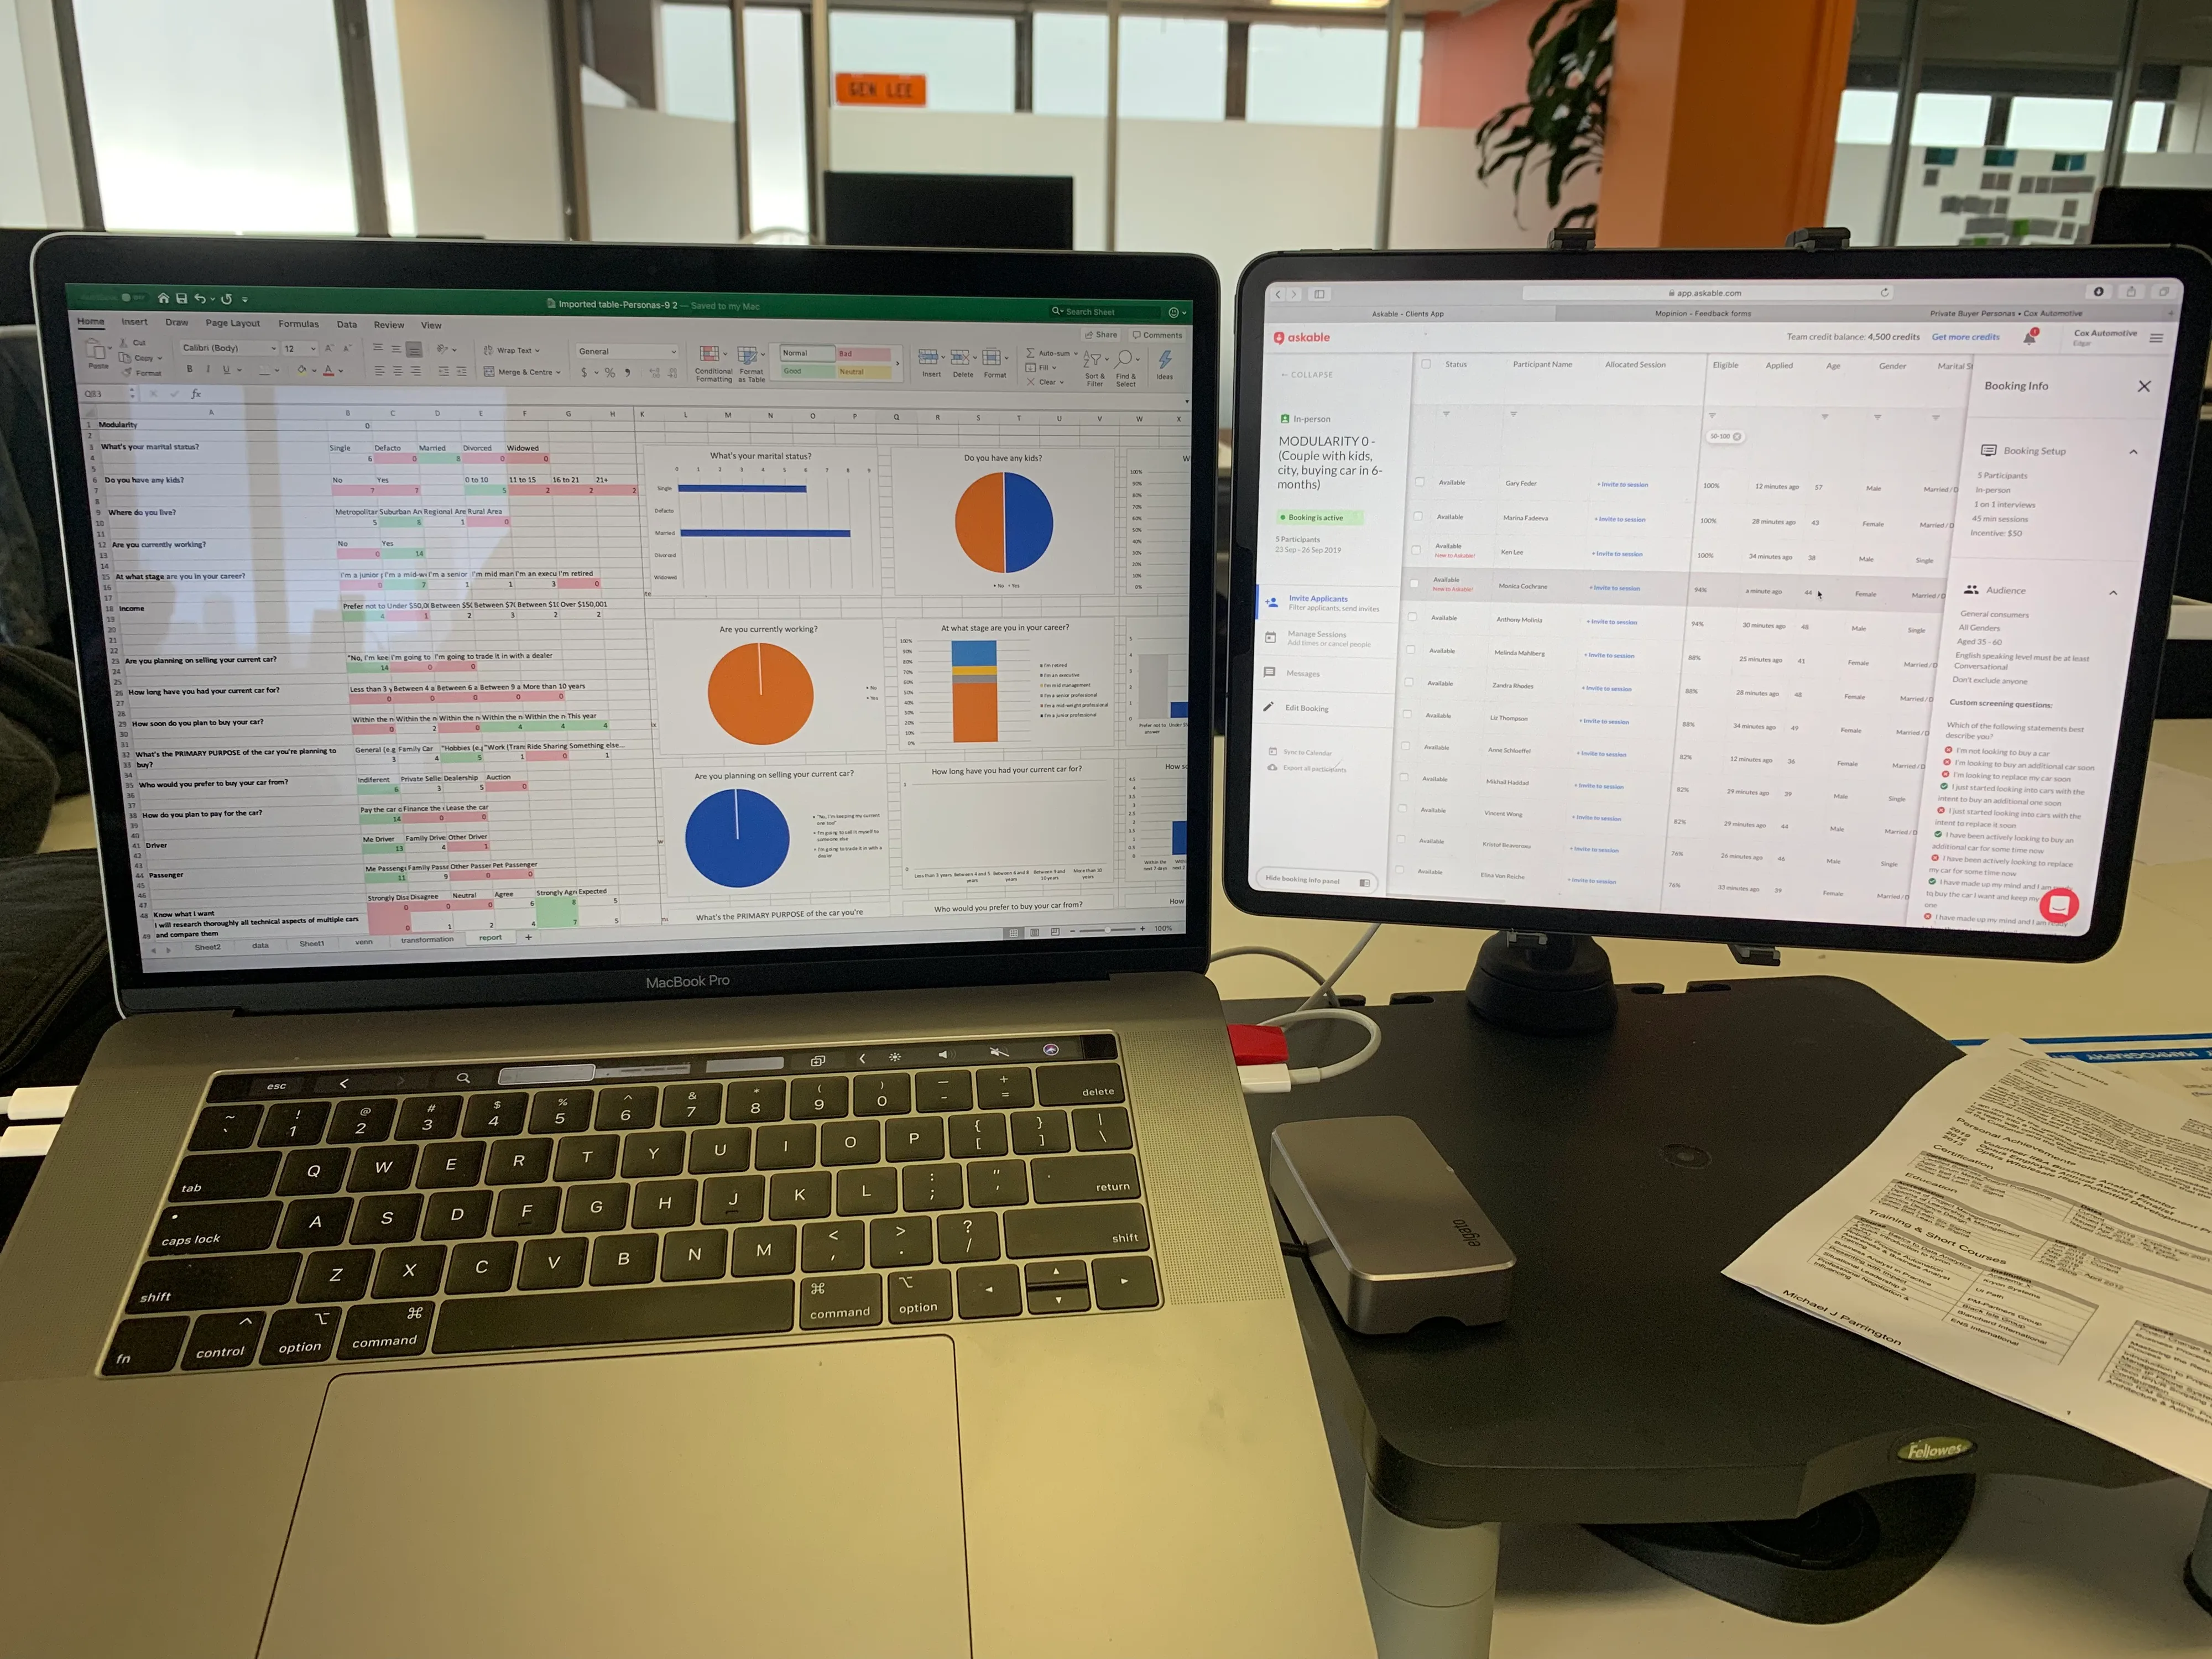
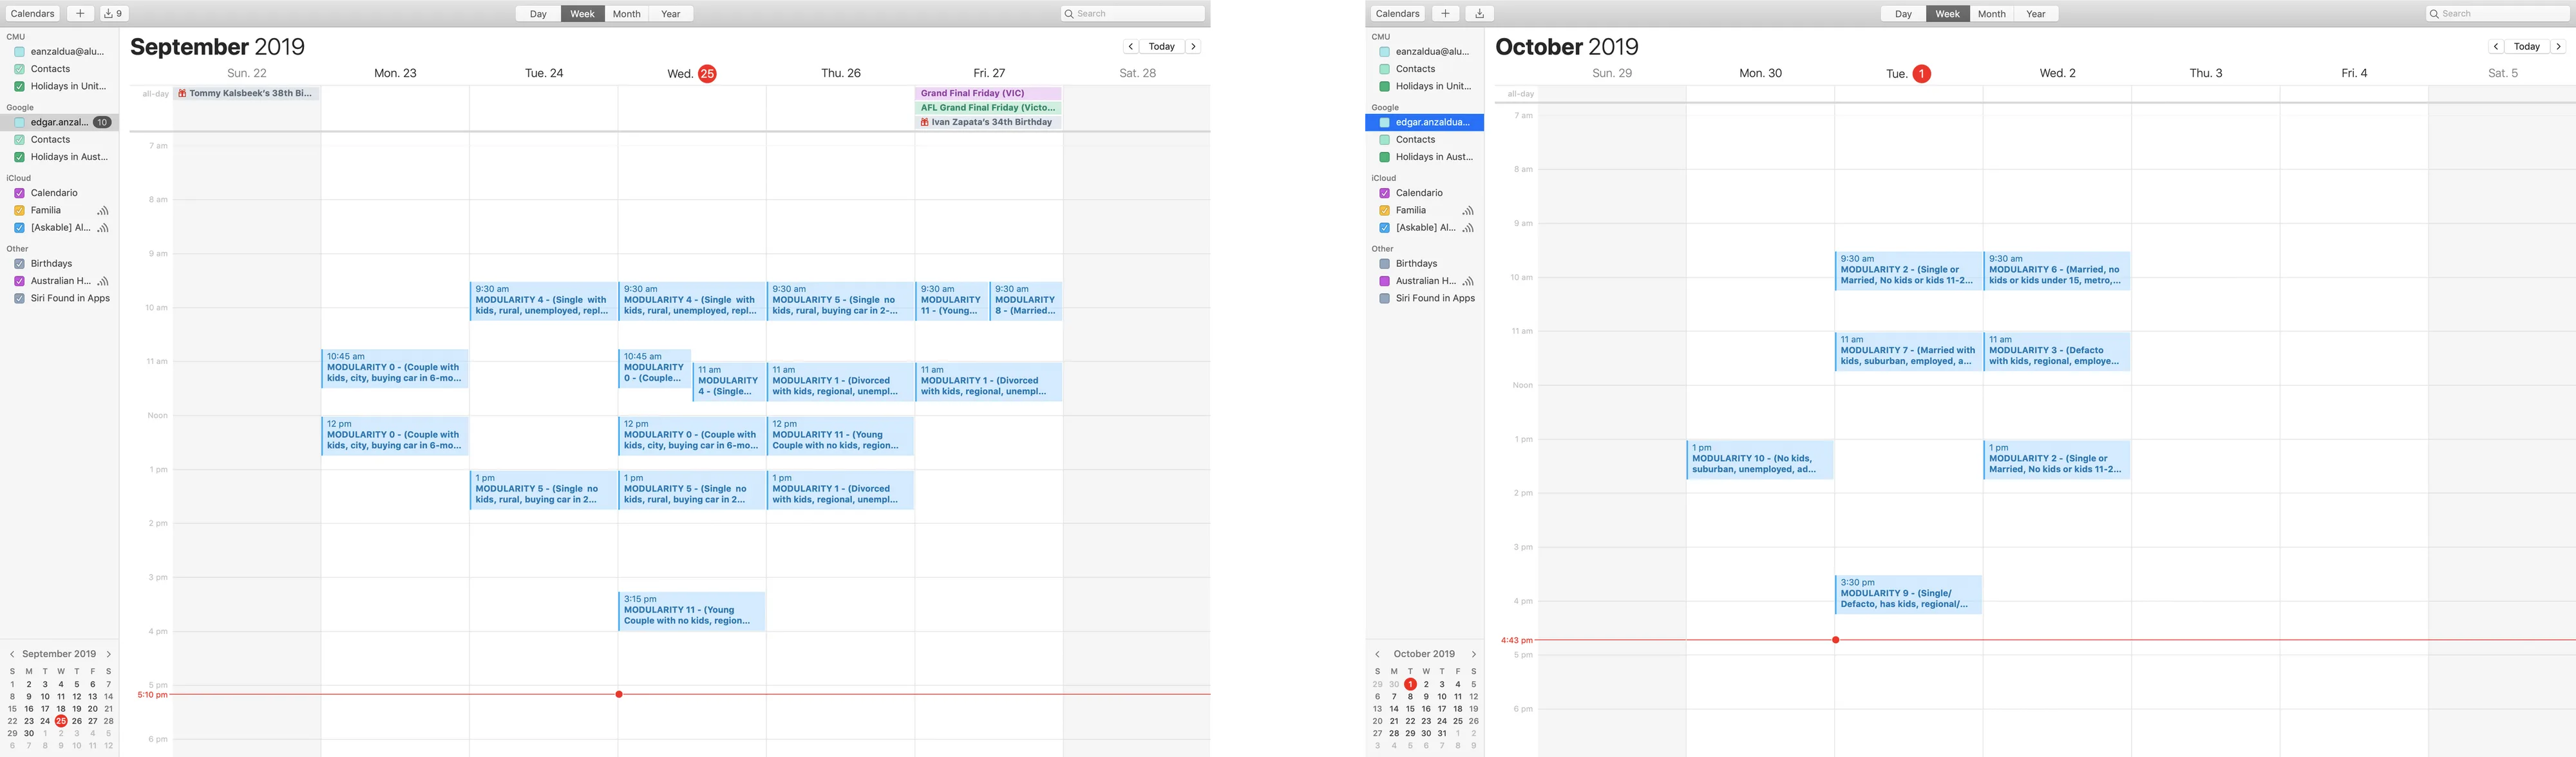
5. Interviews
Two UX Research Assistants helped me perform a total of 30 interviews. This number was a result of looking at the volume of people in each modularity and bringing 2 to 4 people according to the size of the modularity.
We showed up to each interview with their screener answered, and we would verify their story quickly at the beginning of the interview. There after questions were asked in a semistructured way, to be able to tell a story that began with the trigger of wanting a car, and ended with the way they celebrated buying.
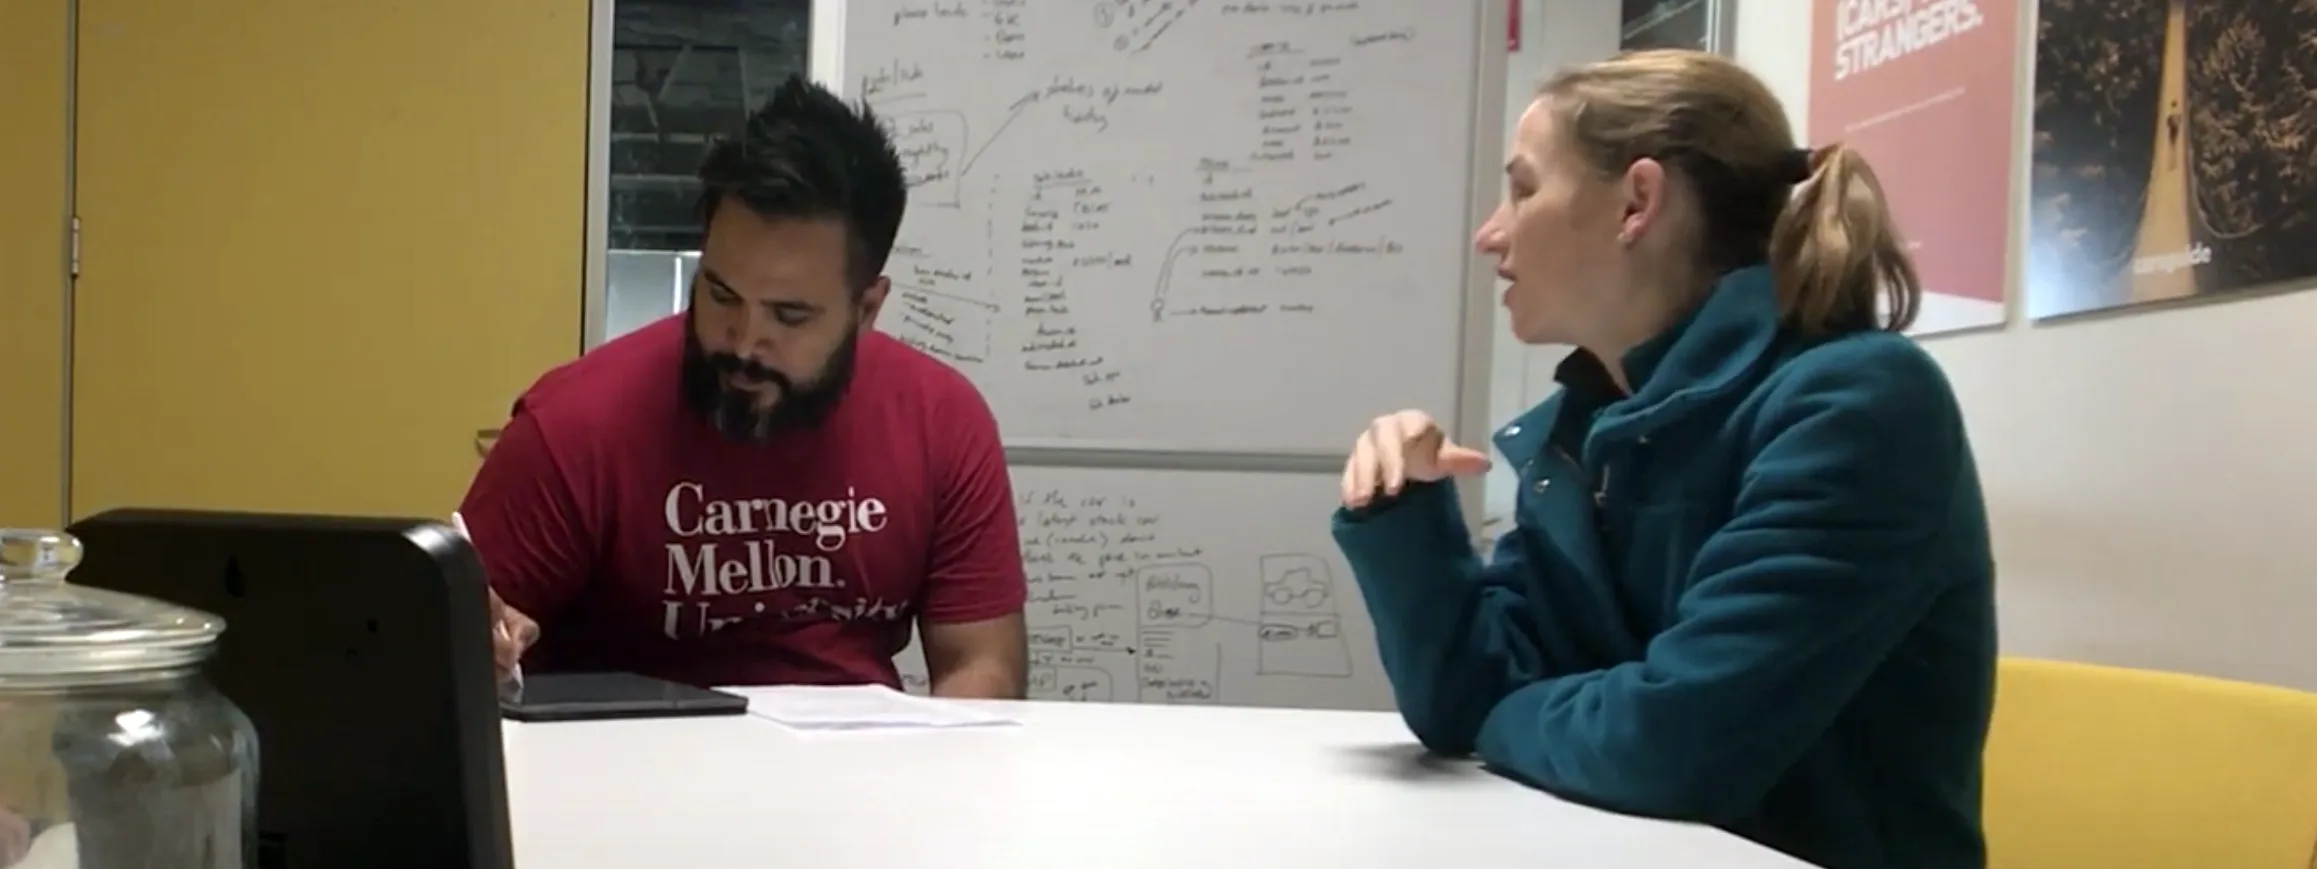
All interviews were recorded in audio as a safety net, with the appropriate consent.
6. Research Based Personas
6.1 Collecting notes
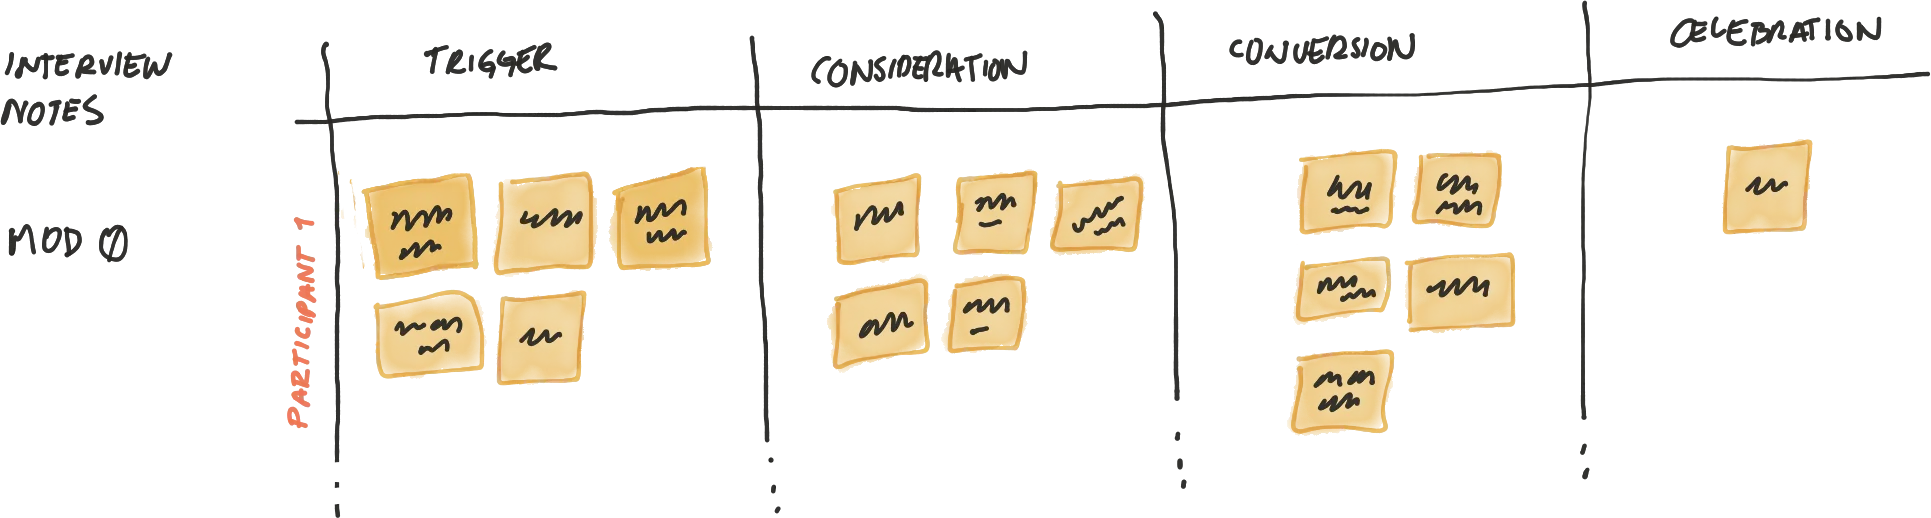
After each session notes were transcribed and categorised into post-it notes in four different stages.
- Trigger. That thing that made people want to buy a car until before they actually start researching.
- Consideration. High level research that is focused to a few different brands.
- Conversion. Activities that happen during the buying process once one's mind is made up.
- Celebration. Things that happen after the car has been bought. Specially things that involve communicating to other people.
6.2 Affinity Diagraming Modularities
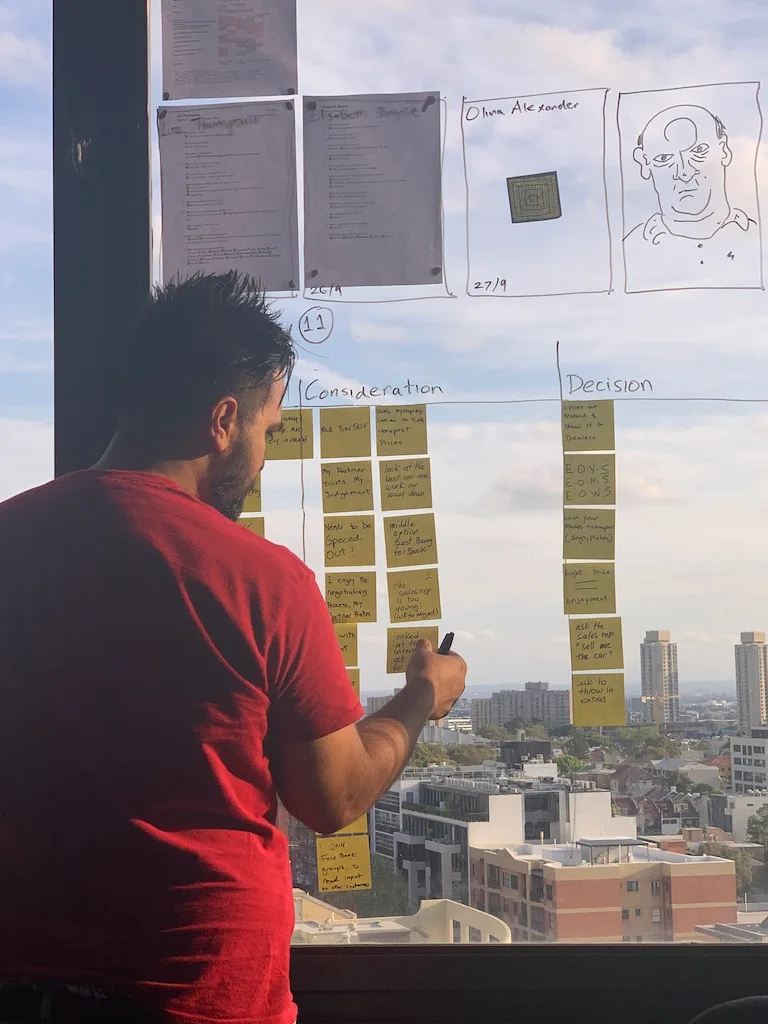
Each modularity had a many post-it notes. Therefore we removed some based on repetition or themes.
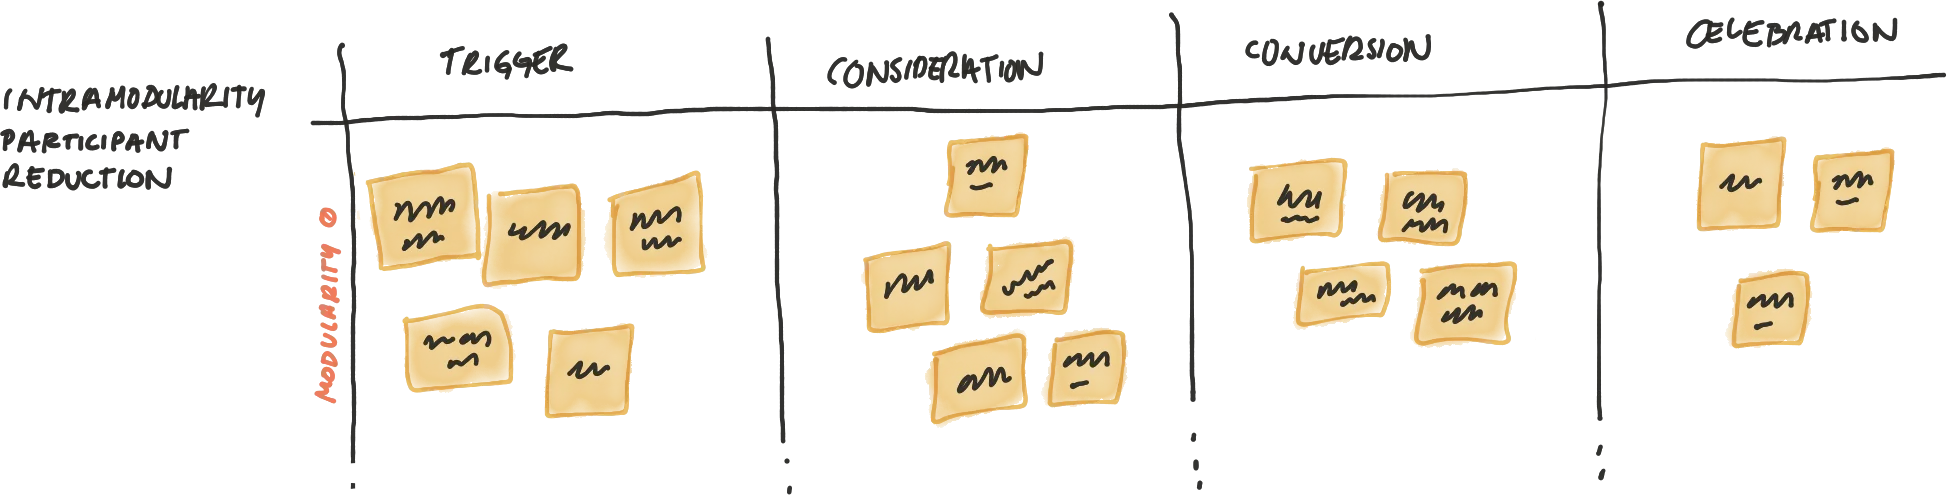
The difference between 7.1 and 7.2 is that 7.1 has Participants and a lot of post its, and 7.2 has Modularities and fewer post its.6.3 Finding Personas
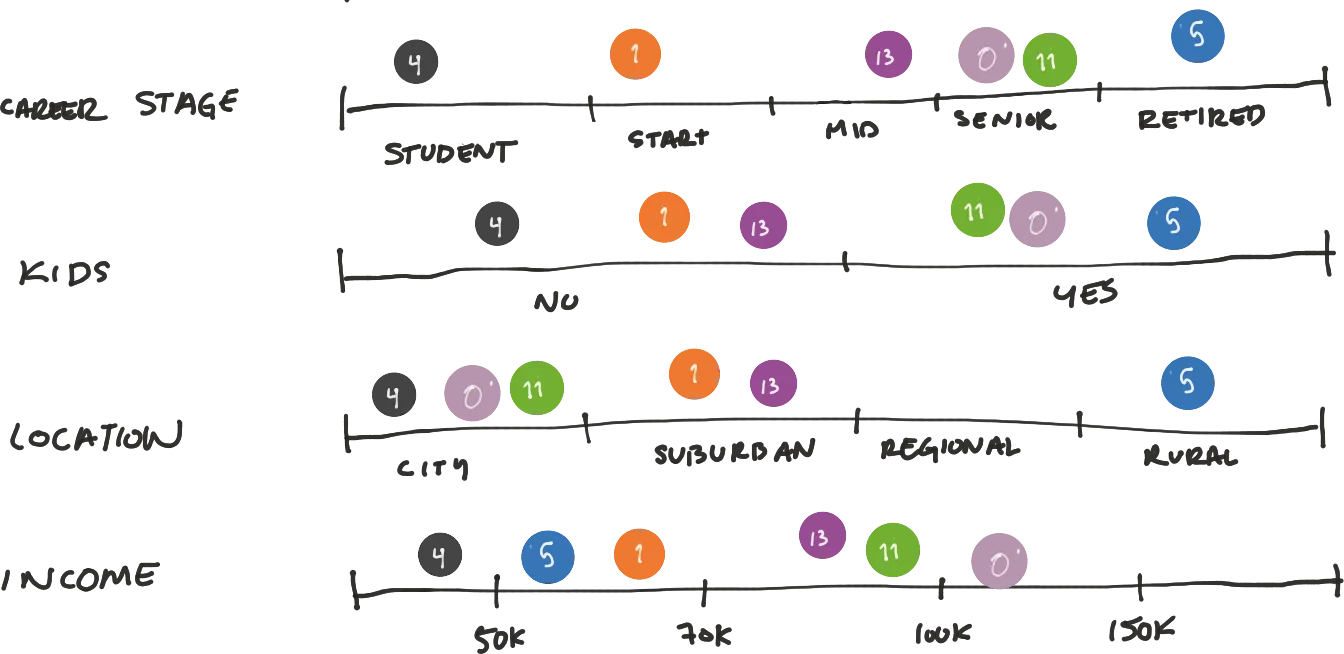
From all modularities we found all the key attributes that we had to consider (which was similar to the ones described in point 5. And we started cross referencing each modularity against the attributes and their values.
6.3 Finding Personas
From all modularities we found all the key attributes that we had to consider (which was similar to the ones described in point 5. And we started cross referencing each modularity against the attributes and their values.
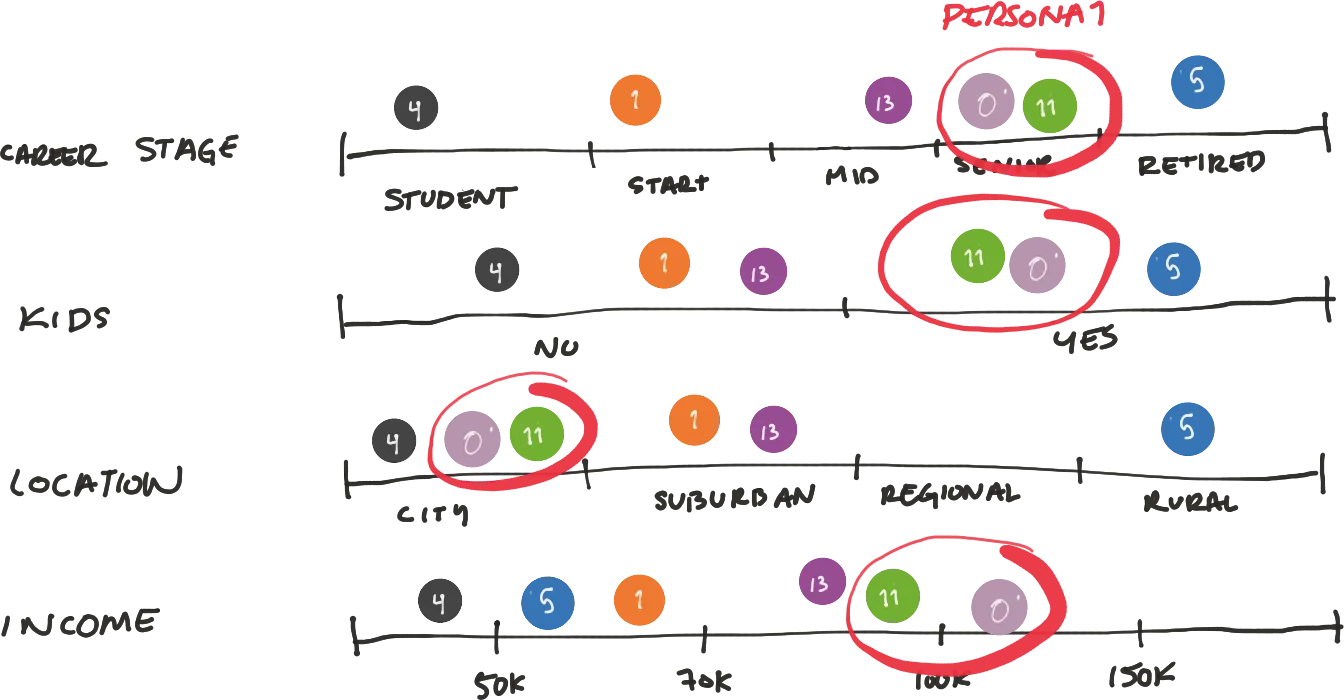
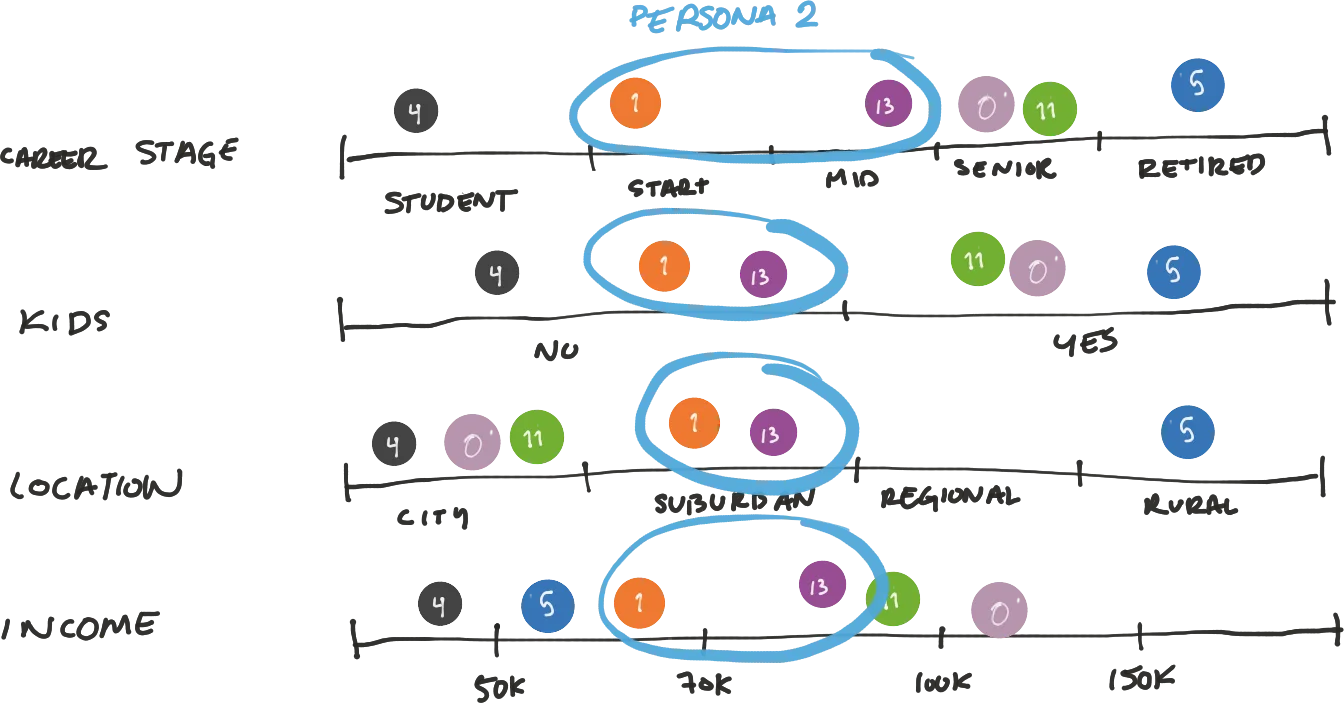
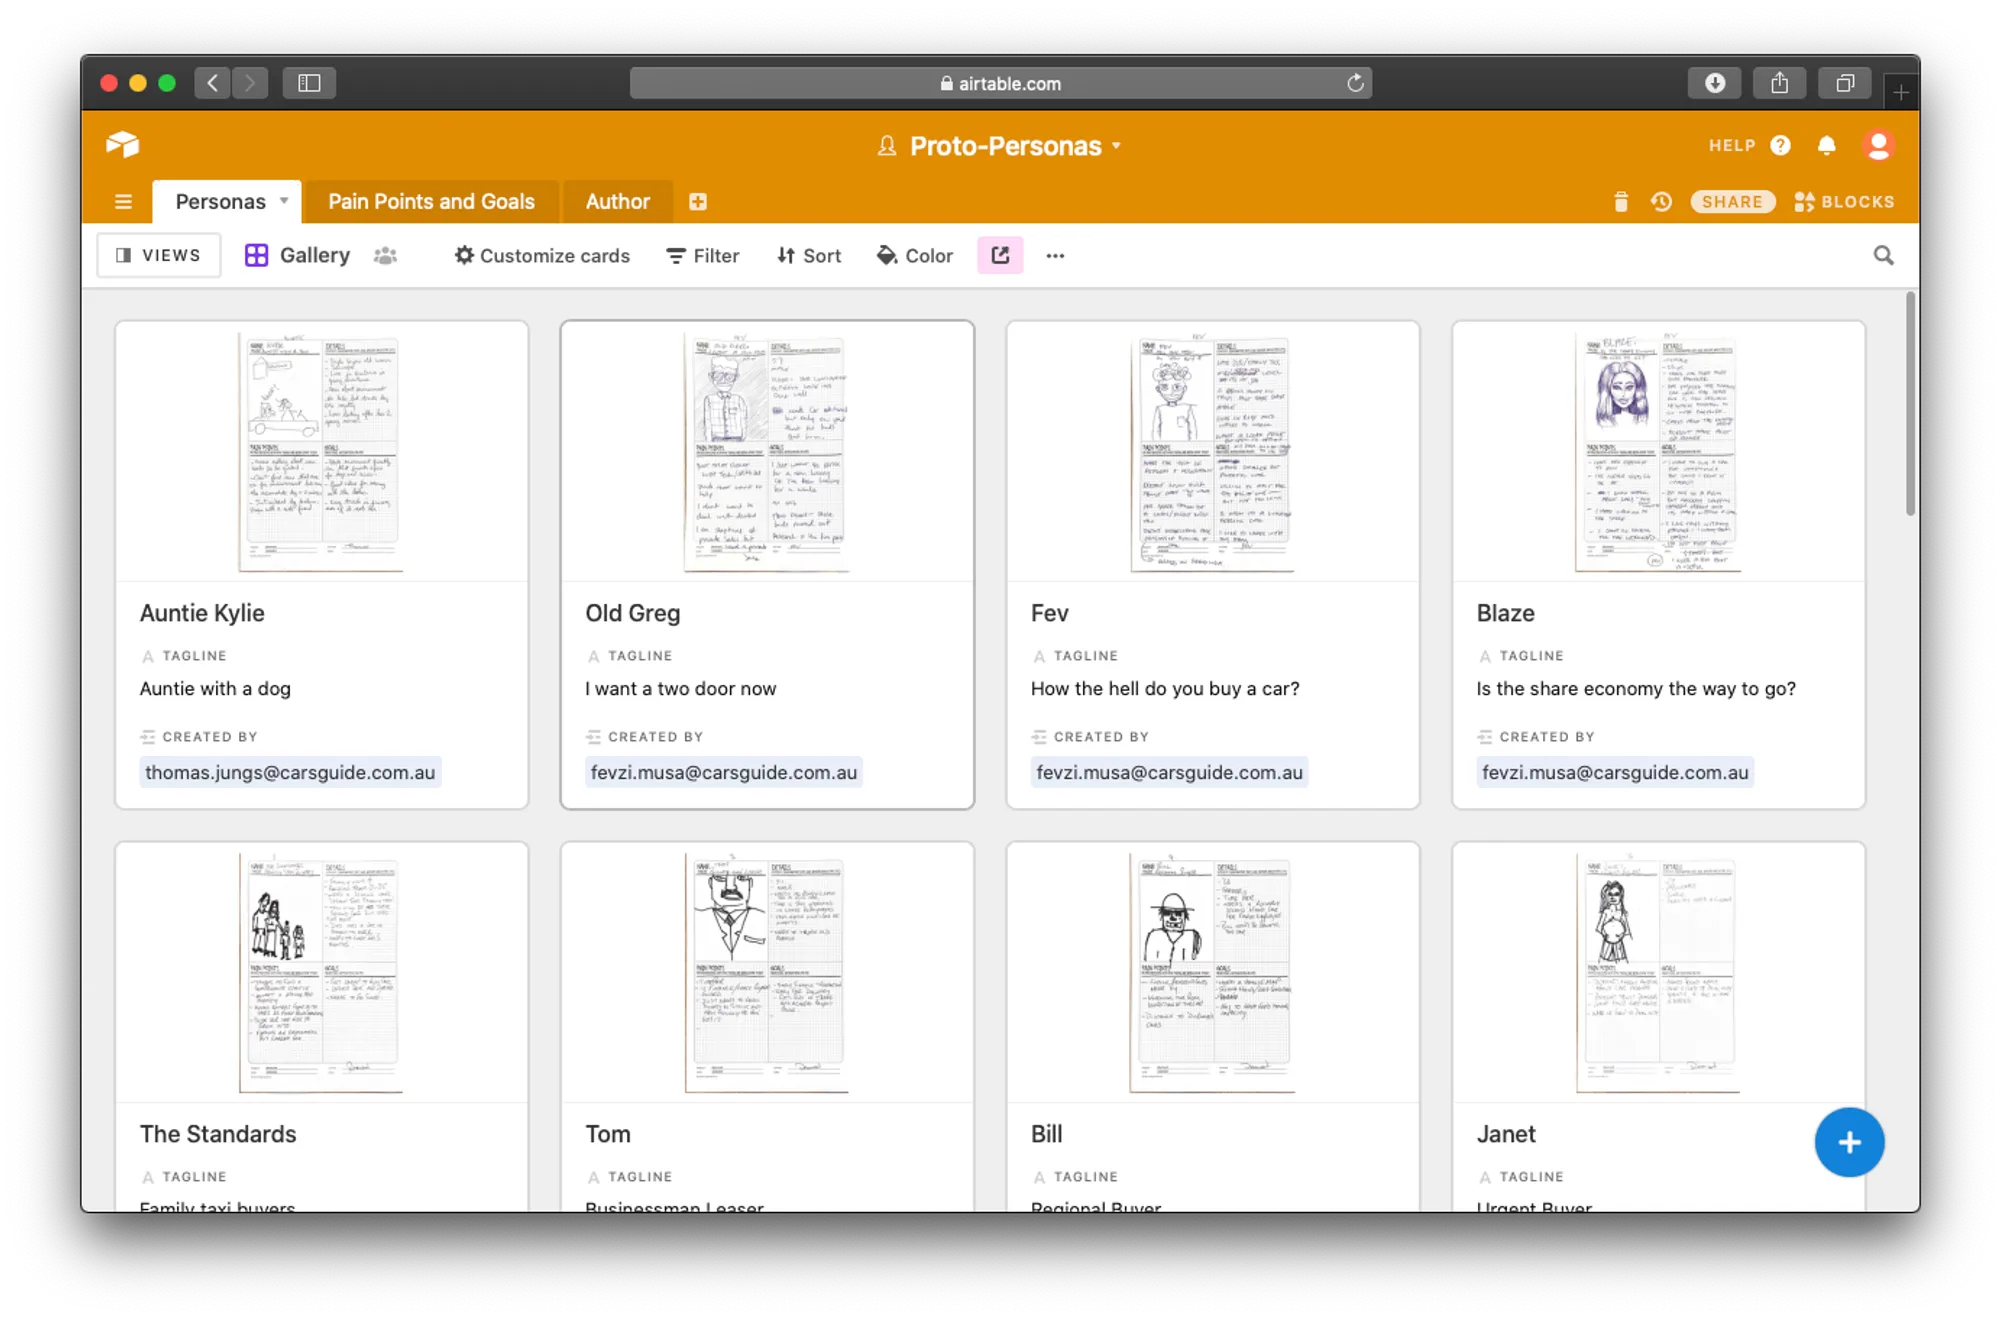
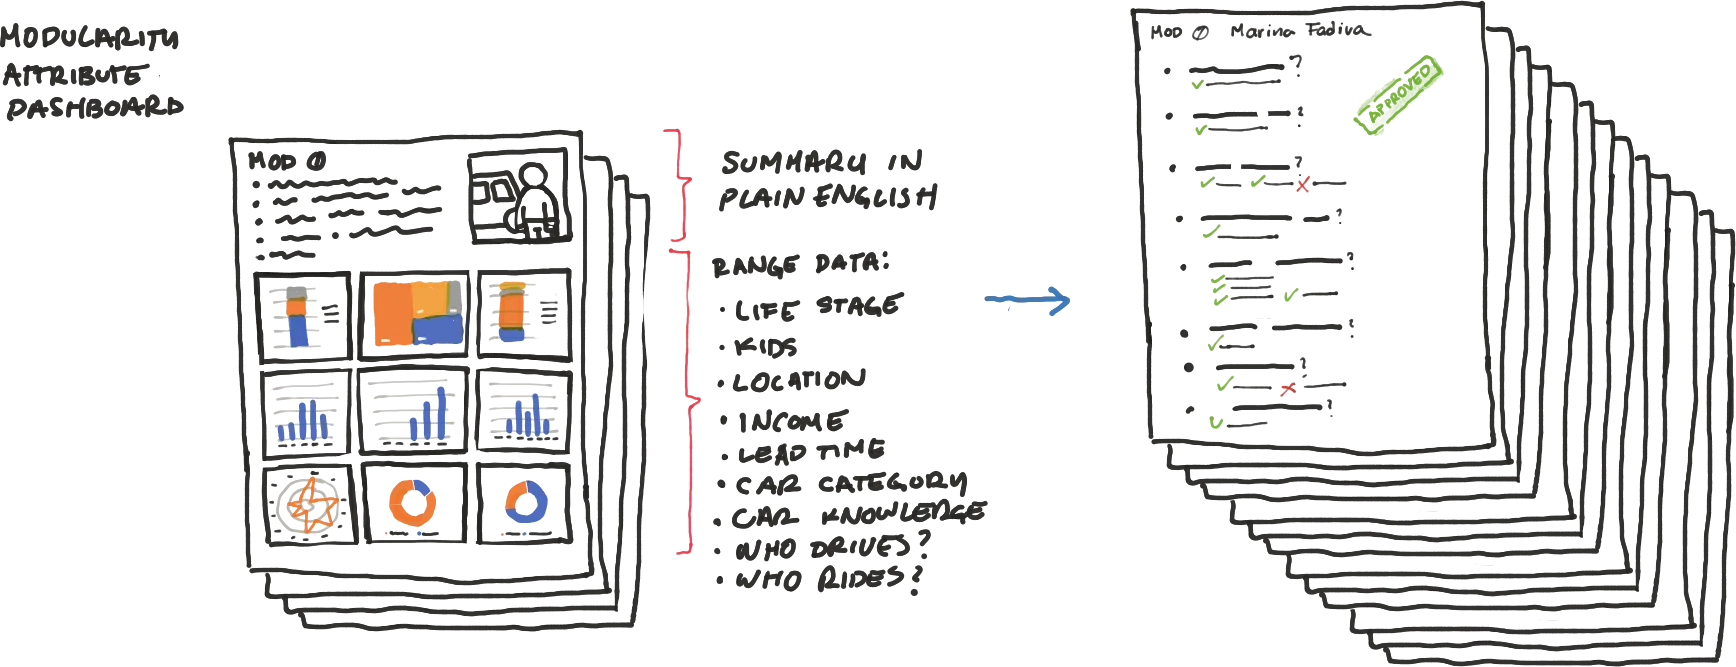
6.4 Documenting Personas
Once all correlations between modularities were found we look at the paper-trail, the attributes, the screening questions, the notes, etc. And we put together a summary story that allows us to consolidate with confidence that persona.

7. Journey Mapping
Once we had all the 5 personas we created a Journey Map for each of them, that allowed us to visualise their emotional journey during the car buying/selling process.
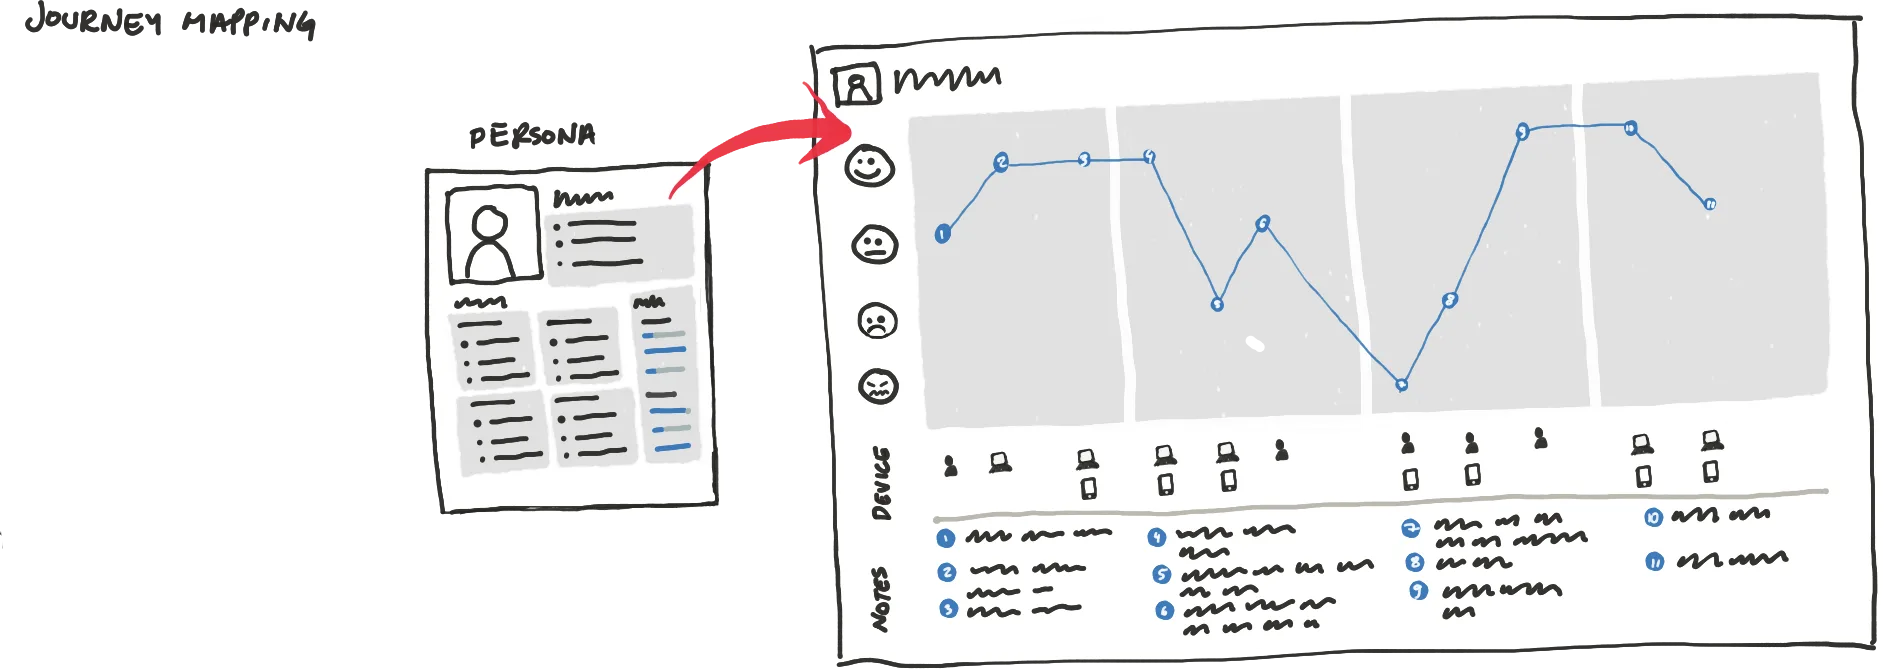
By doing this, you make sure that you can activate your research.
- I led and worked this process from beginning to end, however I got really valuable help from two great UXR assistants; David Solomovic and Michael Parrington, direct reports to me, which challenged me during the process and helped me shape it and refine it.
- The whole process including interviews took a couple of months and involved recruitment of David and Michael, finding the right Participant Panel (Askable), and navigating the back and forth with the management team.
Edgar held the role of UX Design & Research Manager at Carsguide between 2019 – 2019 in Sydney, NSW.
RELATED CASE STUDIES